. 2023 Oct 18;14(45):12973–12983. doi: 10.1039/d3sc04064j

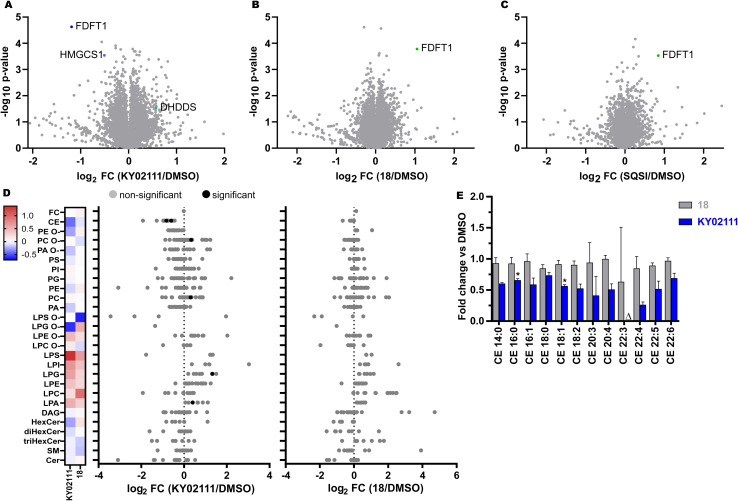
Fig. 5. Global proteomic and lipidomic analysis of KY02111- and 18-treatment in HeLa cells. (A–C) Proteomic profile of HeLa cells treated with KY02111 (10 μM, A), PROTAC 18 (5 μM, B) or SQSI (1 μM, C) for 18 h. The soluble fraction of the lysates was labeled with 16-plex TMT labels and subjected to MS/MS analysis. The analysed data was plotted as −log10p-value vs. log2 FC (FC = fold change, n = 3). Please see extended dataset 1 for complete proteomics data and analysis; (D) Changes in lipidomic species of HeLa cells treated with KY02111 (10 μM) or 18 (5 μM) for 18 h. Significantly altered species are highlighted, Holm-Šídák correction was used to determine adjusted p-values (n = 3, p < 0.005). (E) Fold change overview of cholesteryl ester (CE) classes in HeLa cells treated with KY02111 (10 μM) or PROTAC 18 (5 μM) for 18 h. Significantly altered species are highlighted with * (n = 3, p < 0.005), species below limit of detection are highlighted with Δ. Please see extended dataset 2 for complete lipidomics data and analysis.

Fig. 5