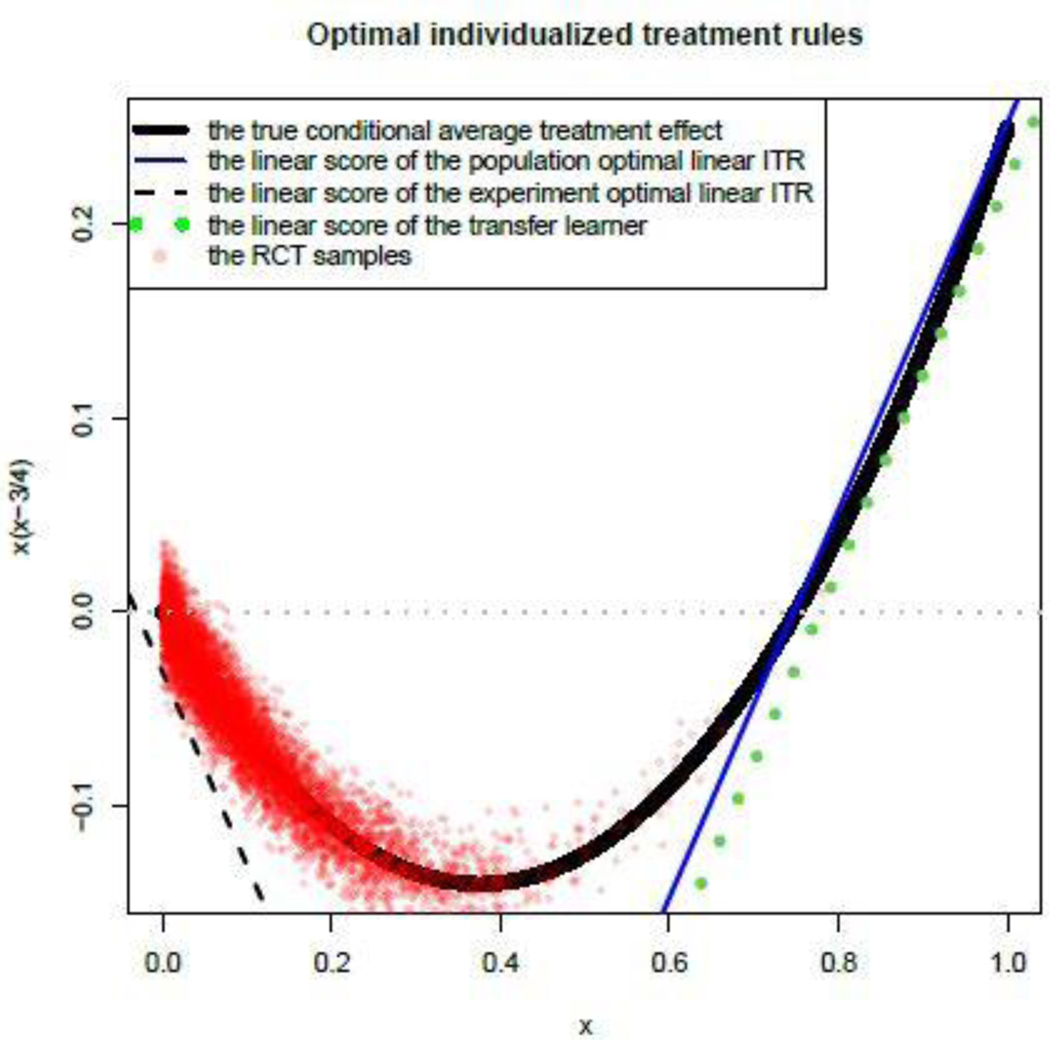
Fig. 1.
Linear scores from the population, experiment, and transfer-learned optimal linear ITRs. The population follows Unif[0,1] (the x-axis), and the conditional average treatment effect is (the solid black line). The experimental sample of size 6227 (red dots) is selected based on a Bernoulli trial with selection probability , and the RWD sample is a random sample of 8000 from the population. The plot shows that the linear score of the optimal linear ITR based only on the experiment (the dash black line) is far from the population counterpart (the solid blue line); while the one from the transfer learner (the dot green line) becomes closer by utilizing the representativeness of the RWD sample (Section 3).

