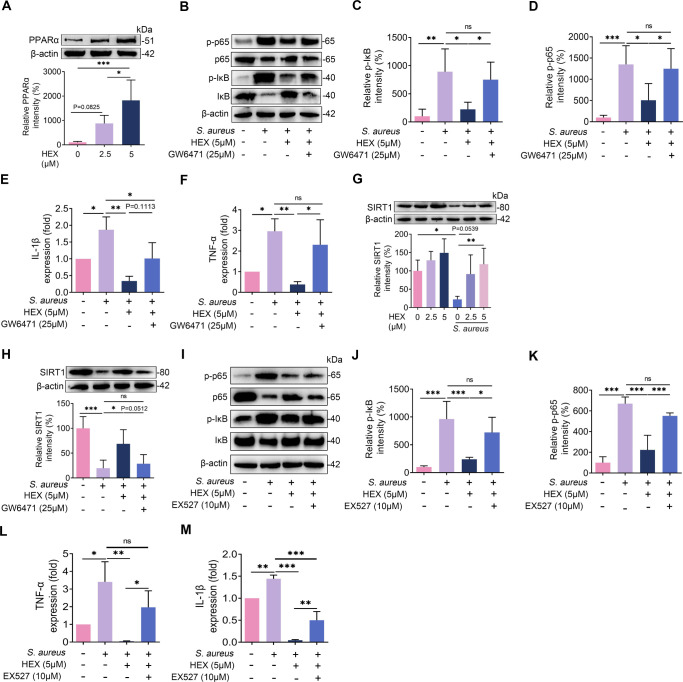
Fig 4. HEX ameliorates S. aureus-induced inflammation in MMECs through PPARα-SIRT1-NF-κB axis.
A-F and H. GW6471 (25 μM) and HEX (5 μM) were performed for 2 h followed by S. aureus (105 CFU) treatment for the next 24 h. A. The relative intensities of PPARα was analyzed by western blotting (n = 5). B-D. Representative image of IκB, p65, and phosphorylation levels of IκB and p65 were shown by western blotting (n = 5). E-F. Inflammatory marker TNF-α and IL-1β were determined using qPCR from different groups (n = 3). G. The cells were pretreated with HEX (0, 2.5, and 5 μM) for 2 h and then treated with S. aureus (105 CFU) for 24 h. The relative level of SIRT1 was measured (n = 5). H. The relative intensity of SIRT1 was detected from different groups (n = 5). I-M. The cells were pretreated with 10 μM EX527 for 2 h and then stimulated with 105 CFU S. aureus for 24 h (n = 5). I-K. Representative image of IκB, p65, and phosphorylation levels of IκB and p65 from the indicated cells. The levels of IκB, p65, and phosphorylation levels of IκB and p65 were detected (n = 5). L-M. The levels of TNF-α (L) and IL-1β (M) were determined by qPCR (n = 3). Data are presented as the means ± SD (A, C-H and J-M) and one-way ANOVA was performed for statistical analysis (A, C-H and J-M). *p < 0.05, **p < 0.01, and ***p < 0.001 indicate significant difference. ns, no significance.

