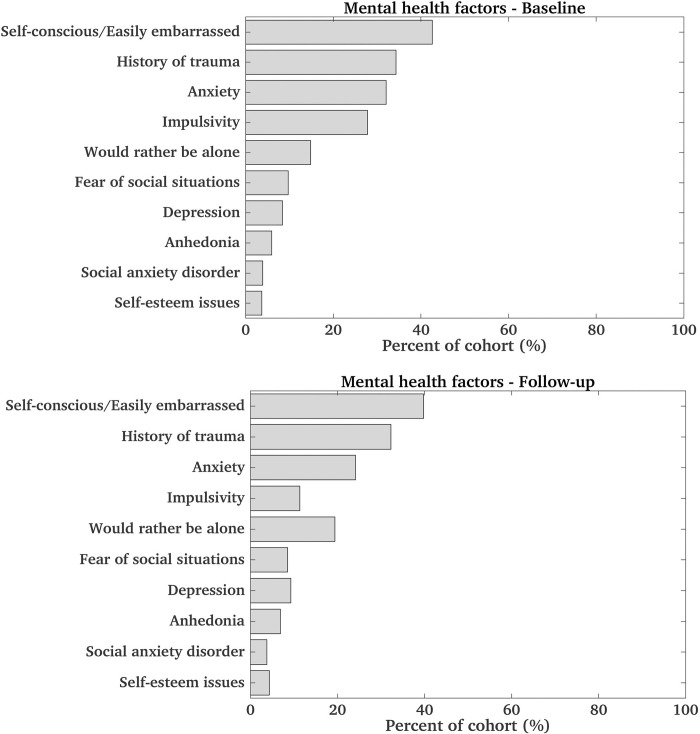
Fig 2.
Distribution of mental health factors in the cohort at baseline (top) and follow-up (bottom). In both bar graphs, these factors are sorted based on prevalence at baseline. For factors associated with questions on a scale ‘Not true’, ‘Sometimes true’, ‘Always true’, prevalence for the combined sometimes and always true responses is provided. Note that anxiety and depression values may be an overestimate due to ABCD coding issues. For factors extracted from the parent diagnostic interview, yes to any related questions (for past or present) was assumed as a positive response.

