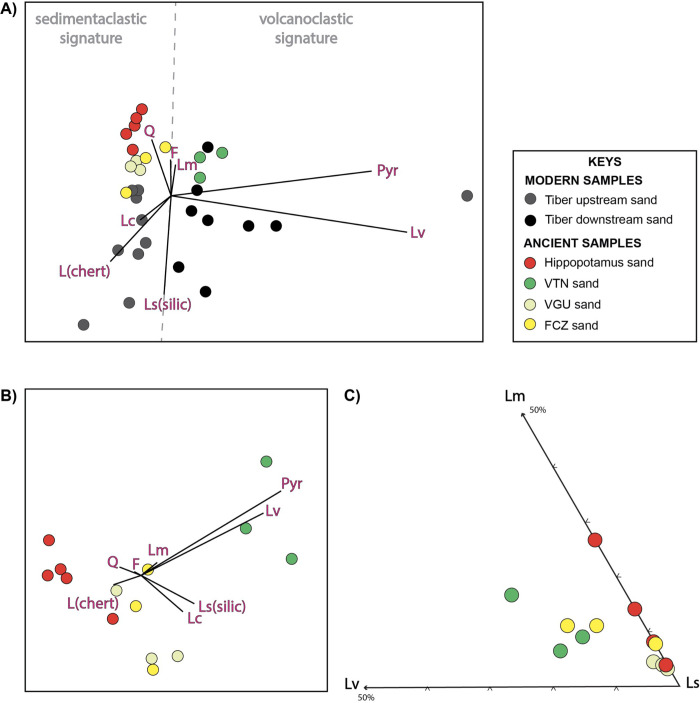
Fig 7.
Compositional biplots [63] displaying data from modern Tiber upstream and downstream sand and ancient sand samples from the Vitinia (VTN), Valle Giulia (VGU), and Fosso della Crescenza (FCZ) Formations (A and B). Rays represent the parameters in the datasets (Q, total quartz; K, K-feldpsar; P, plag; Lc, carbonate lithics; Lm, metamorphic lithics; Lv, volcanics; Hm, dense minerals). The length of each ray is proportional to the variability of the parameter in the data set; the angle between two rays reveals whether the corresponding parameters are well correlated (0°), uncorrelated (90°), or inversely correlated (180°) (from [64]). Note in A) that the modern upstream samples cluster with the Hippopotamus, VGU, and FCZ samples; conversely volcanoclastic downstream fluvial samples cluster with VTN sand. LmLvLs ternary diagram comparing the ancient sand lithic fragments composition. Note that the hippopotamus sediment samples overlap the lithic signature of the VGU sand (C).

