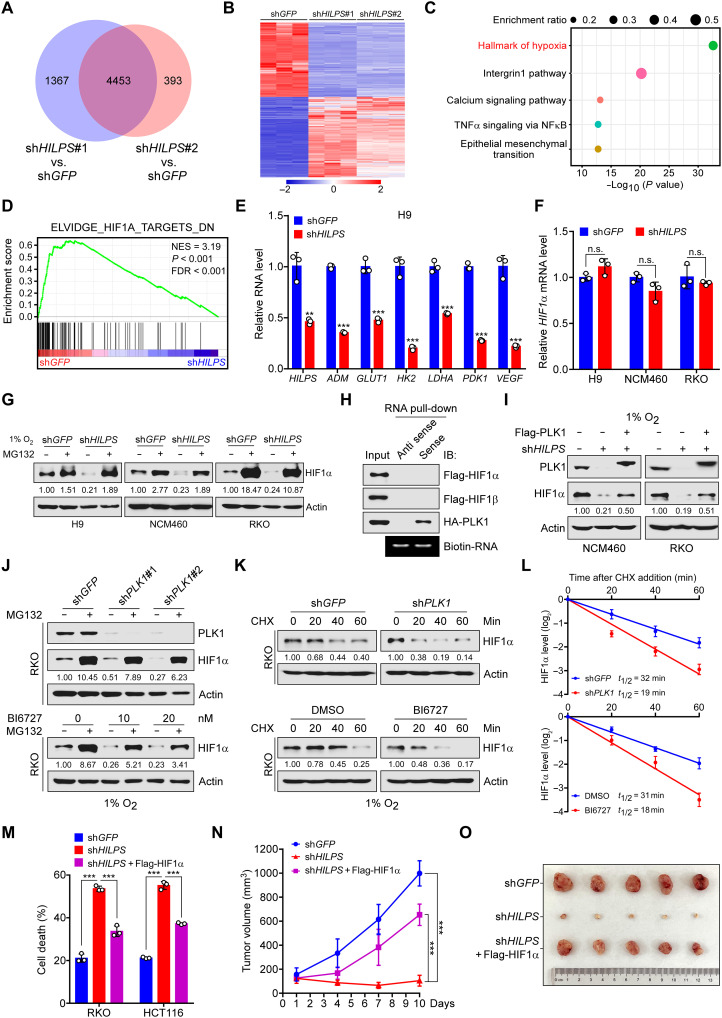
Fig. 5. Inhibition of HILPS-PLK1 axis induces HIF1α degradation and impairs HIF1α signature gene expression.
(A to C) Venn diagram of differentially expressed genes (DEGs) resulting from 1% O2-cultured H9 cells expressing shHILPS#1 or shHILPS#2 (A). Heatmap presentation (B) and enrichment analysis (C) of 4453 merged DEG in (A). Pathway enrichment was analyzed by Metascape (www.metascape.org). TNFα, tumor necrosis factor–α; NFκB, nuclear factor κB. (D) Gene set enrichment analysis of HIF1α target gene sets in the expression profiles of H9 cells expressing HILPS shRNA#1 (software.broadinstitute.org/gsea). NES, normalized enrichment score; FDR, false discovery rate. (E) qPCR analysis of HIF1α target genes in HILPS-depleted H9 cells exposed to 1% O2. (F) qPCR analysis of HIF1α mRNA in HILPS-depleted cells exposed to 1% O2. (G) Immunoblots of HIF1α in HILPS-depleted cells treated with MG132 (10 μM) for 6 hours before harvest. (H) Biotin-labeled HILPS pull-down assay using lysates from 293T cells expressing tagged proteins. (I) Immunoblots of HIF1α and PLK1 in HILPS-depleted cells with or without Flag-PLK1 overexpression. (J) Immunoblots of HIF1α and PLK1 in PLK1-depleted (top) or BI6727-treated (bottom) RKO cells subjected to 1% O2 exposure. (K and L) Time-course analysis of HIF1α degradation in PLK1-depleted (top) or BI6727-treated (bottom) RKO cells subjected to 1% O2 exposure. HIF1α was analyzed by immunoblotting (K) and quantified as shown in (L). (M) Cell death analysis of HILPS-depleted cells cultured in 1% O2 with or without ectopic HIF1α. (N and O) Tumor growth of HILPS-depleted HCT116 xenografts with or without ectopic HIF1α (n = 5) (N). Tumors were dissected 2 weeks after engraftment (O). Data shown are means ± SD from biological triplicates. **P < 0.01 and ***P < 0.001; unpaired two-tailed Student’s t test [(E) and (F)] and one-way ANOVA [(M) and (N)].

