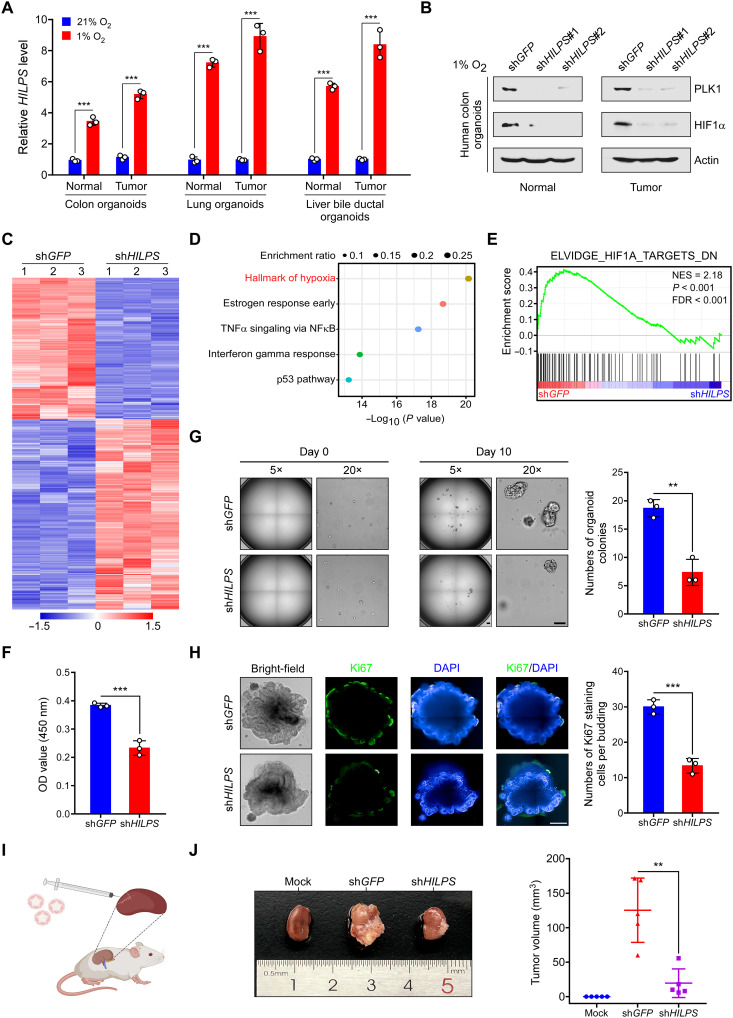
Fig. 7. HILPS inhibition impedes human organoid growth under hypoxia.
(A) qPCR analysis of HILPS in human normal and tumor organoids exposed to 21 or 1% O2 for 24 hours. (B) Immunoblots of PLK1 and HIF1α in 1% O2-treated human organoids derived from normal colon tissue and colorectal cancer upon HILPS depletion. (C to E) Heatmap presentation of all DEG upon HILPS depletion by shRNA#1 in colorectal cancer organoids exposed to 1% O2 (C). Pathway enrichment analysis of DEG by Metascape (D). Gene set enrichment analysis of HIF1α target gene sets in the expression profiles of HILPS-depleted colorectal cancer organoids (E). (F) Proliferation of colorectal cancer organoids exposed to 1% O2 upon HILPS depletion. Organoid proliferation was assessed by CCK-8. OD, optical density. (G) Representative bright field images of colorectal cancer organoids cultured under 1% O2 upon HILPS depletion (left). Scale bars, 200 μm. Quantitation of viable organoid colonies is shown on the right. (H) Representative images showing bright-field view and immunofluorescence staining of Ki67 in HILPS-depleted colorectal cancer organoids cultured under 1% O2 (left). DAPI was stained to visualize the organoids in dark field. Scale bar, 200 μm. Quantitation of Ki67 positive staining cells per budding are presented (right). (I) Schematic depicting patient-derived organoid–based xenograft model. (J) Representative images of colorectal cancer organoid–based tumors in the subrenal capsule with or without HILPS depletion (left) and measurement of tumor volumes (n = 5) (right). Data shown are means ± SD from biological triplicates. **P < 0.01 and ***P < 0.001; unpaired two-tailed Student’s t test [(A), (F), (G), and (H)] and one-way ANOVA (J).

