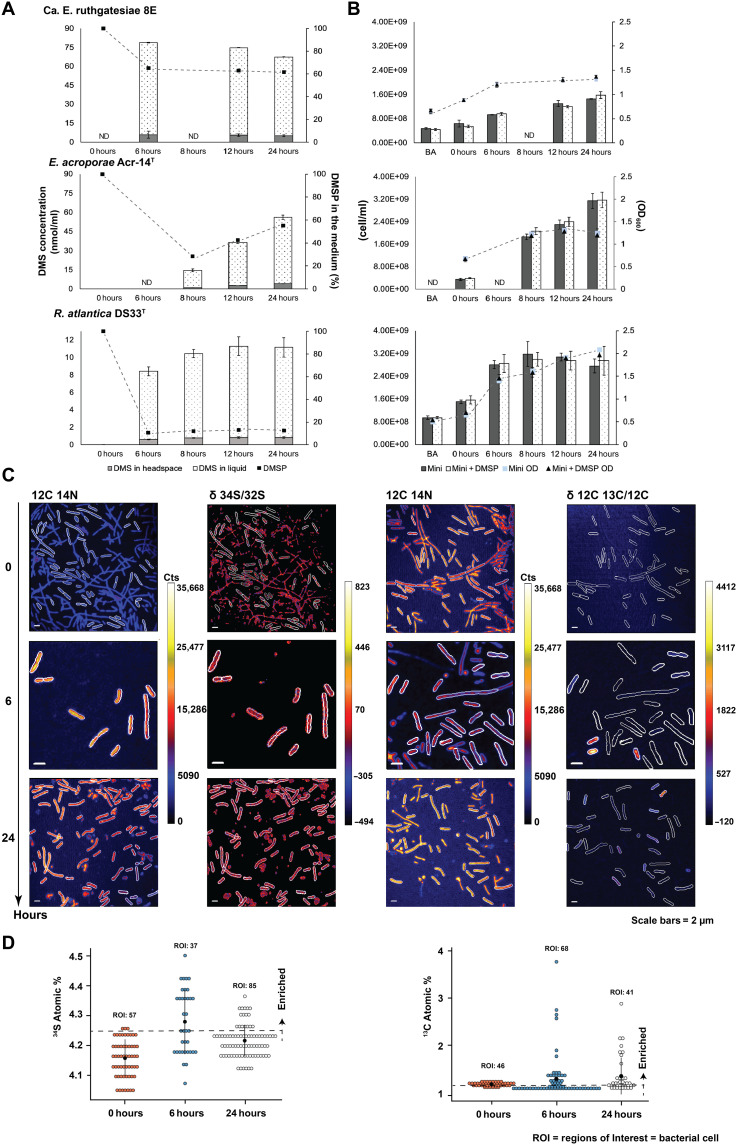
Fig. 4. DMS concentration, DMSP consumption, and growth condition of bacterial cultures in minimal medium.
(A) Time courses for production of DMS (nmol/ml) and DMSP utility (%). DMS in headspace: The DMS concentration in treatment and the values were direct measurements of DMS by GC-MS. DMS in liquid: The DMS concentration in the treatment medium and the values were calculated based on Bunsen solubility coefficient. The line chart shows the percentage of DMSP in treatment medium starting from 0.1 mM DMSP. (B) Bacterial cell number and optical density at 600 nm (OD600) value. Bar charts show the cell number measured by flow cytometry. Line charts show the value of OD600 which started from 108 cell/ml. BA, before acclimation; mini, control without DMSP; mini + DMSP, treatment with DMSP; mini OD, control OD600 value; mini + DMSP OD, treatment OD600 value. (C) The DMSP metabolism of 8E were determined using 34S and 13C label stable isotope at the single-cell level. Example parallel images of 12C14N counts, sulfur isotope ratio (34S/32S), and carbon isotope ratio (12C13C/12C). (D) 34S atomic % and 13C atomic % isotopic composition of ROIs in the scatterplot. The nature 34S atomic % is 4.25 and 13C is 1.07; ROIs higher than the value were marked as enriched. ND, not determined.

