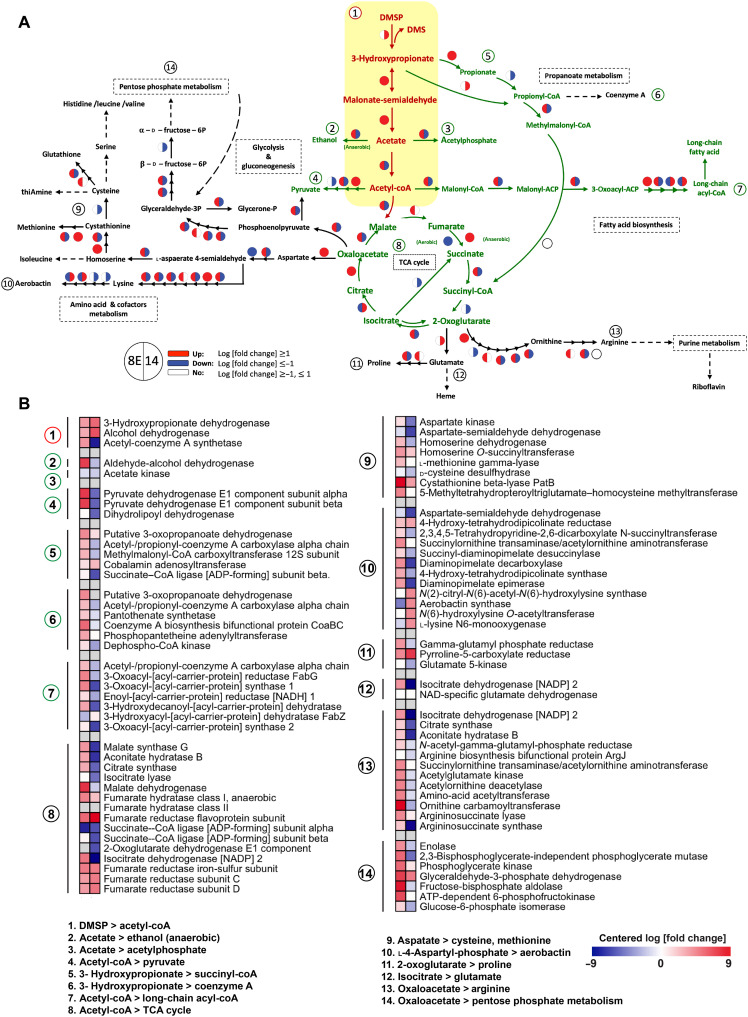
Fig. 5. Differential expression of DMSP related pathway in two Endozoicomonas species.
(A) The putative dddD centered pathway. The center pathway of dddD-mediated DMSP is marked in red, and the pathway directly linked with the dddD-mediated DMSP pathway is marked in green. The indirectly linked pathway is marked in black. The circle symbol represents the log [fold change] according to DESeq2, with down-regulation (log [fold change] ≤ 1) in blue, up-regulation (log [fold change] ≥ 1) in red, and no regulation (log [fold change] ≥ −1 and ≤ 1) in white. The color in the left side of the circle belongs to 8E, and the color in the right belongs to E. acroporae Acr-14T. (B) The log fold change heatmap of the putative pathway related with DMSP degradation. The numbers indicate the genes included in the pathway in (A).

