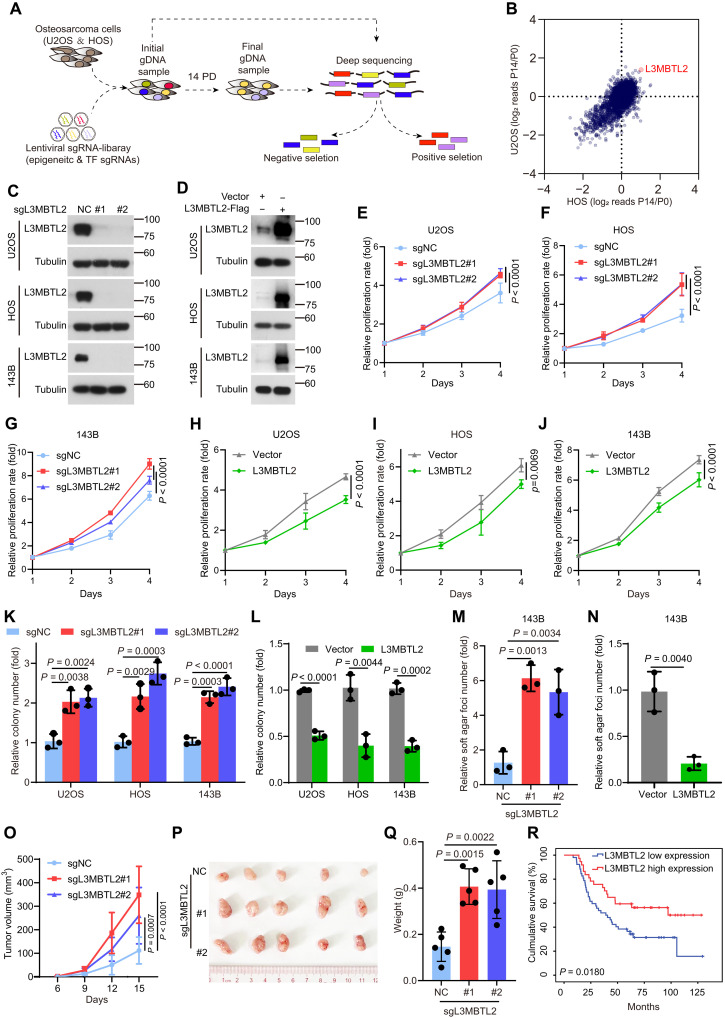
Fig. 1. CRISPR-Cas9 screening of cell viability identifies L3MBTL2 as the tumor suppressor in osteosarcoma.
(A) Schematic of CRISPR screening strategy. (B) Scatter plot comparison of CRISPR screening in U2OS and HOS cells. Plotted is the average log2 fold change in abundance of all sgRNAs targeting a given gene at final (P14) versus initial reference (P0). (C and D) The indicated stable cells were analyzed by Western blotting. Data are representative of n = 3 biologically independent experiments. (E to J) Cell viability of the indicated stable cells was measured by MTT assay at the indicated time points. (K to N) Colony formation (K and L) and anchorage-independent (M and N) assays were performed for the indicated stable cells. The colony numbers per field were counted. Data in (E to N) are means ± SD of n = 3 biologically independent experiments. P values are shown. (O to Q) The indicated 143B stable cells were subcutaneously injected into mice. (O) Tumor size was measured at the indicated time points, and tumors were dissected at the end point. (P) Representative images of subcutaneous xenograft tumors. (Q) Tumor weight was measured at the end point. n = 5 biologically independent mice. Data are means ± SD. P values are shown. (R) Overall survival curves were analyzed on the basis of L3MBTL2 protein levels in patients with osteosarcoma by Kaplan-Meier method. Fifty-two and 37 cases with low and high expression of L3MBTL2, designed as L3MBTL2 low expression and L3MBTL2 high expression, respectively, were plotted, and P values are shown.

