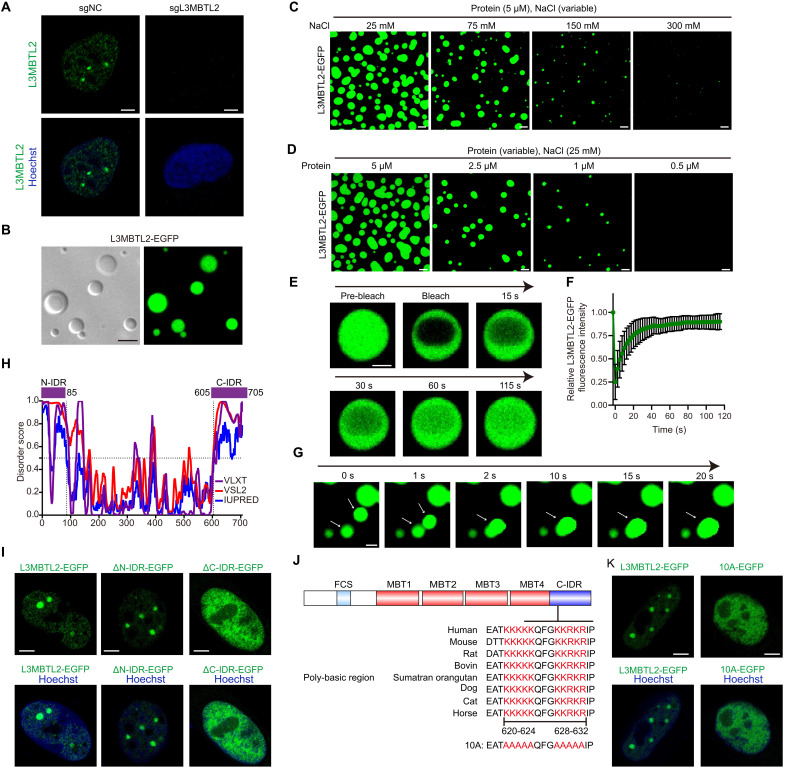
Fig. 3. L3MBTL2 protein forms condensates via both polybasic regions and Pho-binding pocket.
(A) Representative images of immunofluorescence staining for endogenous L3MBTL2 (anti-L3MBTL2, active motif, green) in the indicated U2OS stable cells. (B) Representative differential interference contrast (left) and fluorescence (right) microscopy images of 10 μM purified L3MBTL2-EGFP in the phase separation buffer with 25 mM NaCl for 1 min at 25°C. (C) Representative images of 5 μM purified L3MBTL2-EGFP in the phase separation buffer with the indicated NaCl concentration and 1% (w/v) PEG-6000 for 1 min at 25°C. (D) Representative images of purified L3MBTL2-EGFP at the indicated protein concentration in the phase separation buffer with 25 mM NaCl and 1% (w/v) PEG-6000 for 1 min at 25°C. (E) Representative FRAP recovery images of L3MBTL-EGFP droplets in the phase separation buffer with 50 mM NaCl and 1% PEG-6000 at the indicated times. Scale bar, 2.5 μm. (F) Relative quantification of FRAP recovery kinetics of L3MBTL2-EGFP droplets averaged from n = 12 biologically independent experiments. Data are means ± SD. (G) Representative time-lapse images showing fusion of two droplets formed by 5 μM L3MBTL-EGFP proteins in the phase separation buffer with 50 mM NaCl and 1% (w/v) PEG-6000 for 1 min at 25°C. Scale bar, 2 μm. (H) Analysis of the intrinsically disorder tendency of L3MBTL2 by using PONDR and IUPred2. (I) Representative images of U2OS cells transiently expressing L3MBTL2 wild type (1 to 705 amino acids), ΔN-IDR (86 to 705 amino acids), or ΔC-IDR (1 to 604 amino acids) fused to EGFP. (J) Conservation of PBR sequences (620 to 624 and 628 to 632 amino acids) within L3MBTL2 C-IDR across homologs. 10A: Ten K or R in PBR of L3MBTL2 were mutated to A. (K) Representative images of U2OS cells transiently expressing L3MBTL2 wild type or 10A mutant fused to EGFP. Data in (A to D, G, I, and K) are representative of n = 3 biologically independent experiments. Scale bars, 5 μm (A to D, I, and K).

