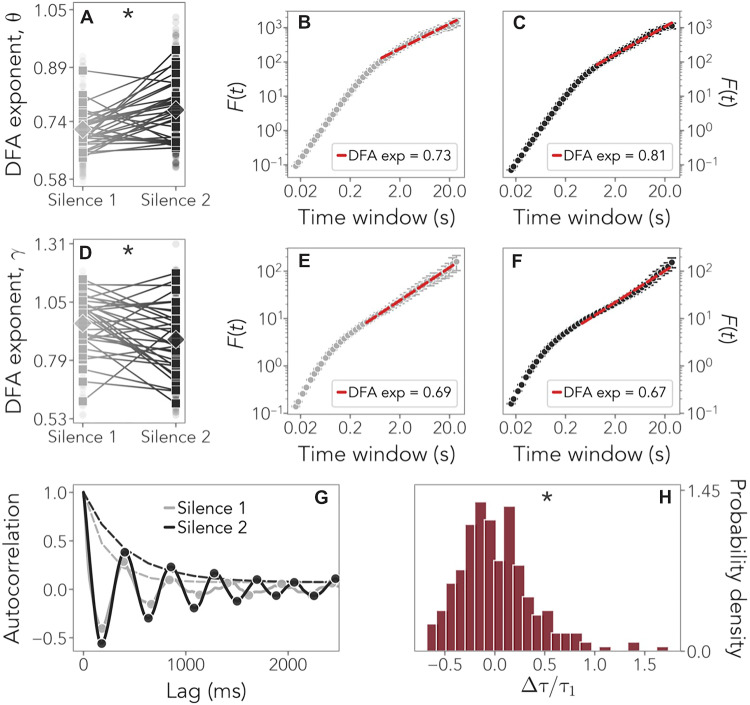
Fig. 2. DFA exponents and temporal correlations.
(A to C) Comparison of the average DFA exponents in the theta band during silence 1 (gray) and silence 2 (black) in channel F8 as an example. Squares indicate individual DFA exponents, and diamonds indicate the average. Statistically significant results are indicated by an asterisk (*). (A) P = 0.0005. (D to F) DFA exponents in the gamma band. (D) P = 0.01. (G) Comparison of the autocorrelation function in channel F8 during silence 1 (gray) and silence 2 (black) and the fits of the corresponding exponential envelopes (dashed lines) whose decay defines the autocorrelation time. (H) Distribution of the relative change in the autocorrelation times, obtained for all channels and all subjects. Its significantly positive skewness suggests that stronger temporal correlations are present after language stimulation. P < 0.00001 for skewness; P = 0.00002 for kurtosis.

