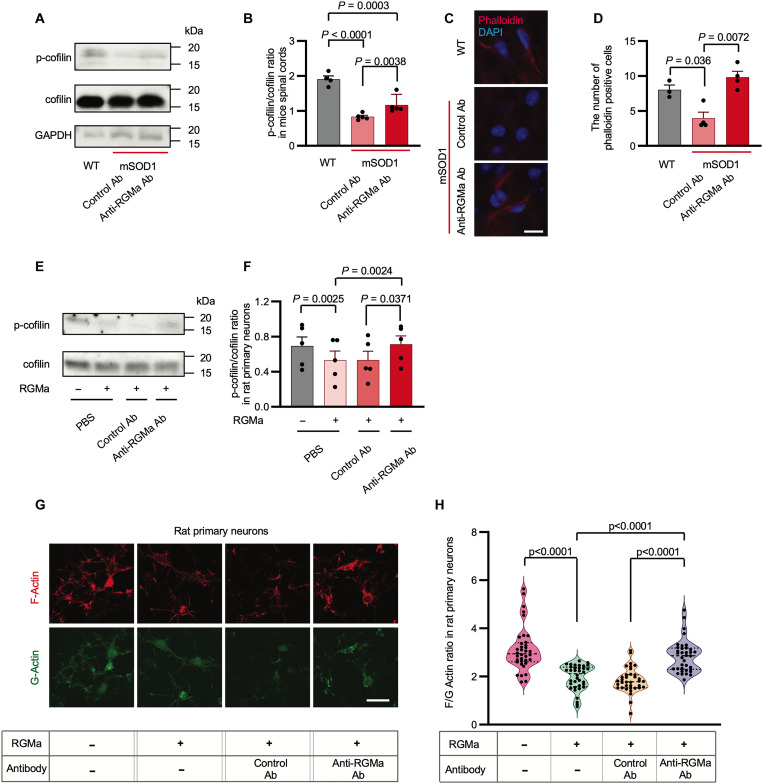
Fig. 5. RGMa promoted cofilin dephosphorylation and actin depolymerization of mSOD1 mice and rat primary cortical neurons.
(A) Immunoblotting assay of cofilin and p-cofilin in the spinal cord lysates of WT (n = 4) or mSOD1 mice treated with anti-RGMa (n = 5) or control Ab (n = 5). (B) P-cofilin/cofilin ratio in (A) is shown. (C) Immunohistochemical analysis of the spinal cord of WT (n = 3) and mSOD1 mice treated with anti-RGMa (n = 4) or control Ab (n = 4) is shown. Slices were stained with phalloidin (red) to reveal actin filaments and DAPI (blue) to reveal the cell nuclei. Scale bar, 30 μm. Representative images are shown. (D) There are a smaller number of phalloidin-positive motor neurons in mSOD1 mice than in WT controls. (E) Immunoblots of cofilin and p-cofilin in rat primary neurons lysates with or without recombinant RGMa, treated with anti-RGMa or control Ab. (F) Quantification of the relative intensity of p-cofilin/cofilin bands in (E). Data from three independent blots were used for the statistics. (G) Immunocytochemical analysis of rat primary neurons with or without RGMa, inoculated with anti-RGMa or control Ab were stained with phalloidin (red) and DNaseI (green) to reveal F-actin and G-actin, respectively. Representative images are shown. Scale bar, 30 μm. (H) Quantifications of F/G ratio are shown. Each filled dot indicates the ratio of F-actin mean intensity to G-actin mean intensity in a single cell. In all the conditions, a total of 36 cells selected from three individual wells of 16-chamber slides were measured (data are representative of two individual experiments). Error bars indicate mean ± SEM. p-cofilin, phosphorylated cofilin; F-actin, filamentous actin; G-actin, globular actin.

