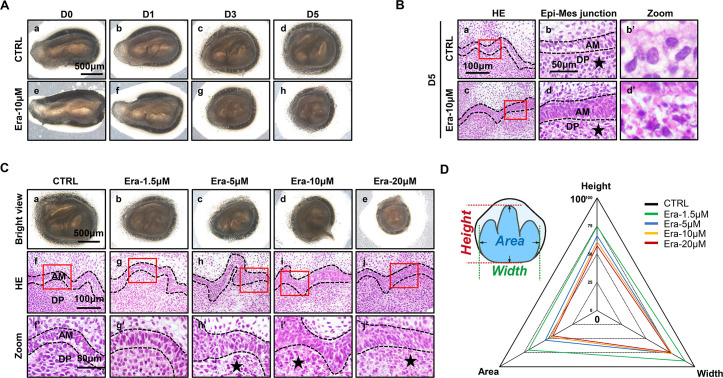
Figure 2. Erastin impairs tooth morphogenesis, especially within dental mesenchyme.
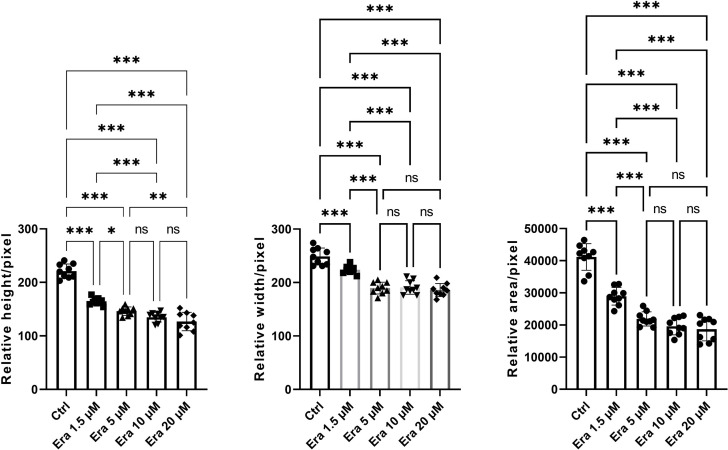
(A) Gross anatomy of tooth germ cultured ex vivo for 5 d, scale bars = 500 μm. (B) (a, c) HE staining for tooth germ on day 5 (D5), scale bars = 100 μm. (b, d) High resolution of epi-mes junction papilla, scale bars = 50 μm; black stars point out necrotic-like cells (NLCs). (b’, d’) NLCs indicated by black stars. (C) (a–e) Gross anatomy of tooth germs in different concentrations of erastin on D5, scale bars = 500 μm. (f–j) HE staining of different concentration-treated tooth germ on D5. (f’–j’) High-resolution view of epi-mes junction region of each tooth germ, scale bars = 50 μm. (D) Rada graph for calculation of height, width, and area in each tooth germ. Black dotted line outlines ameloblasts. AM, ameloblast; DP, dental papilla.


