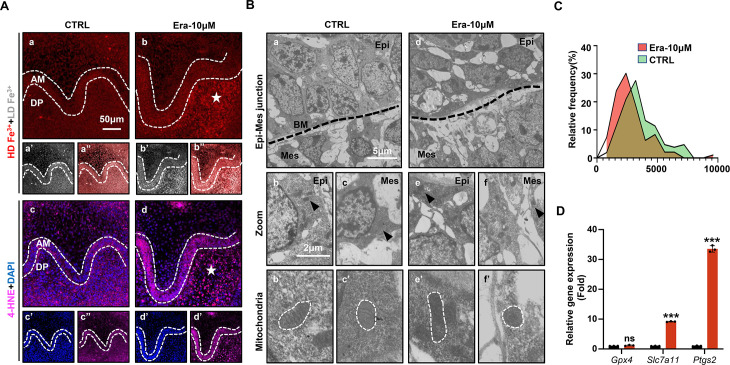
Figure 3. Ferroptosis is activated in erastin-treated molar germ.
(A) (a, b) High-density Fe3+ (red) in CTRL and Era-10 μM of day 5 (D5); white star points out strong fluorescence signal of Fe3+, scale bars = 50 μm. (a’, b’) Low-density Fe3+ (gray) and (a’’, b’’) merged view of iron probe staining. (c, d) Merged view of immunofluorescence (IF) staining of 4-hydroxy-2-nonenal (4-HNE) (magenta) and DAPI (blue), white star points out strong fluorescence signal of 4-HNE, scale bars = 5050 μm. (c’, d’) For DAPI and (c’’, d’’) 4-HNE. AM, ameloblast; DP, dental papilla; HD, high density; LD, low density. (B) Transmission electron microscope (TEM) scanning for CTRL and Era-10 μM on D5. (a, d) epi-mes junction area of CTRL and Era-10 μM on D5 are detected, scale bars = 5 μm. (b, c) Representative view of cells in epithelia and mesenchyme for CTRL, scale bars = 2 μm; black arrow points out typical mitochondria in each region (b’) for epithelia and (c’) mesenchyme, outlined by the white dotted line. (e, f) Representative view of cells in epithelia and mesenchyme for Era-10 μM, scale bars = 2 μm; black arrow points out typical mitochondria in each region (e’) for epithelia and (f’) mesenchyme, outlined by the white dotted line. (C) Relative frequency of the mitochondrial size in both groups. (D) Fold changes of gene expression in CTRL and Era-10 μM on D5 versus CTRL ***p<0.001.


