
Fig. 3.
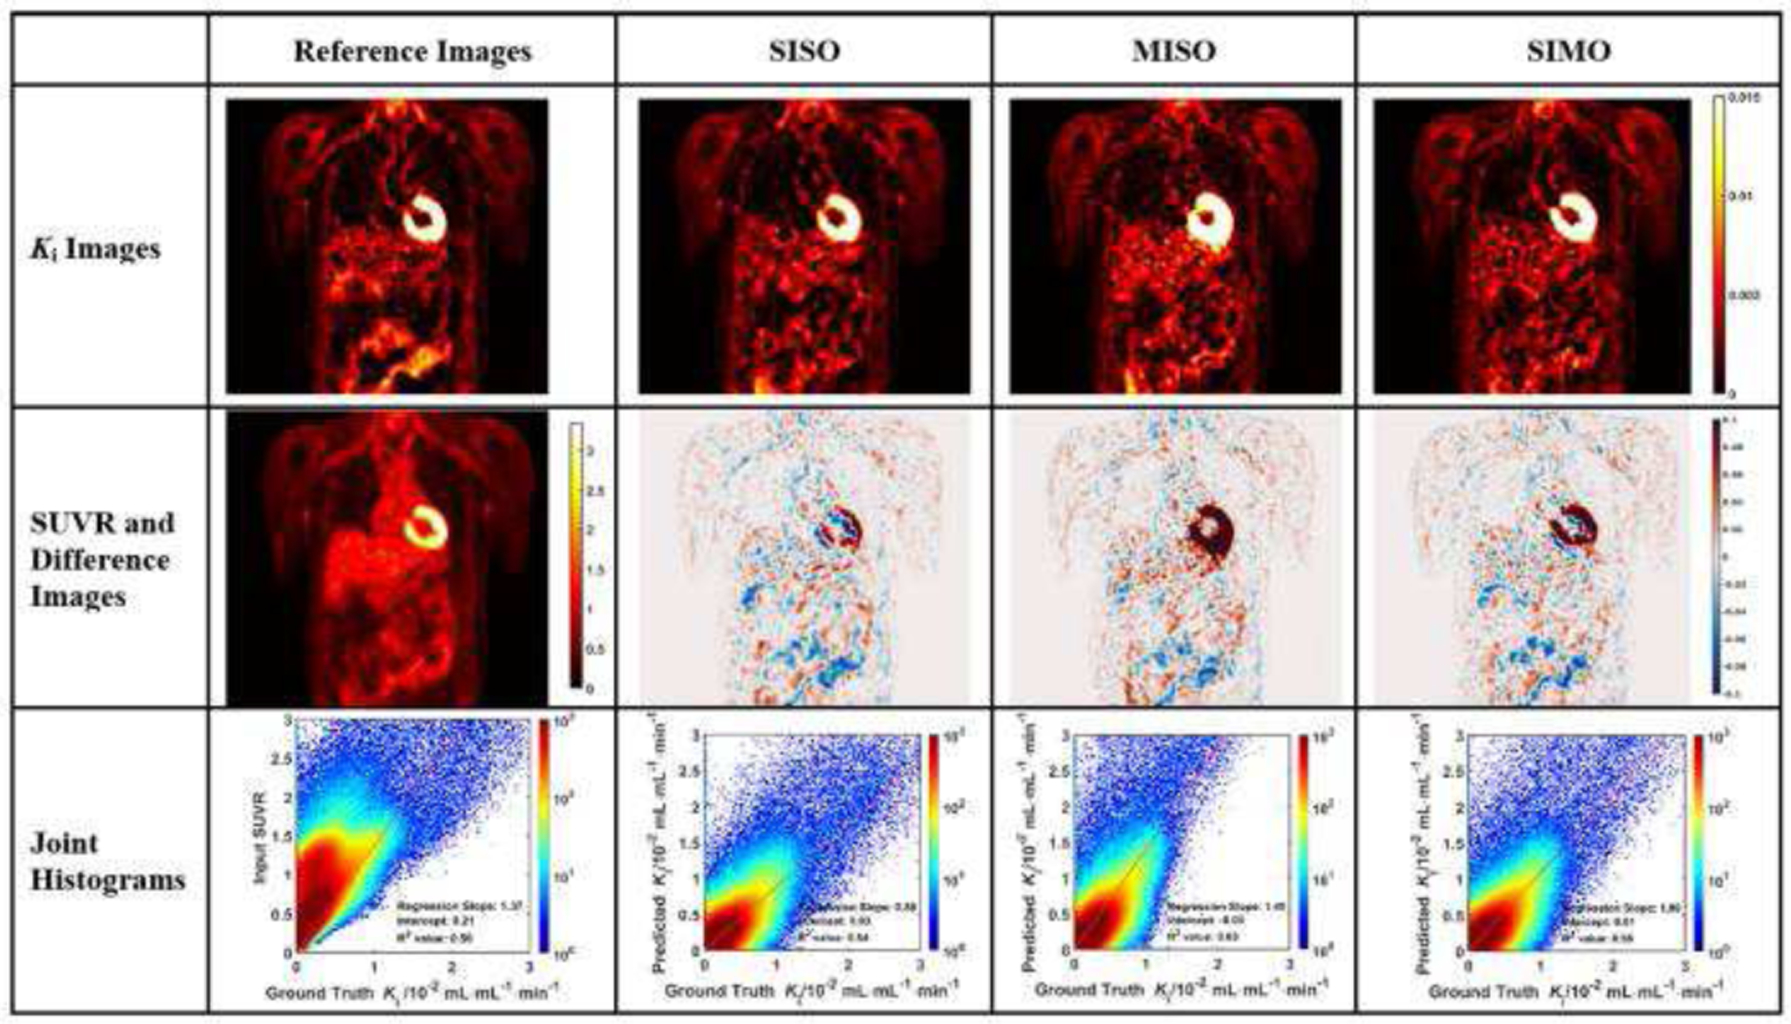
Evaluation analysis of sample subject #1 including the synthetic and reference Ki images, corresponding difference images, SUVR input image, and the joint histograms. In each joint histogram, the regression line was represented by the red straight line, with labels of regression slope, intercept and R2 value.