
Figure 4.
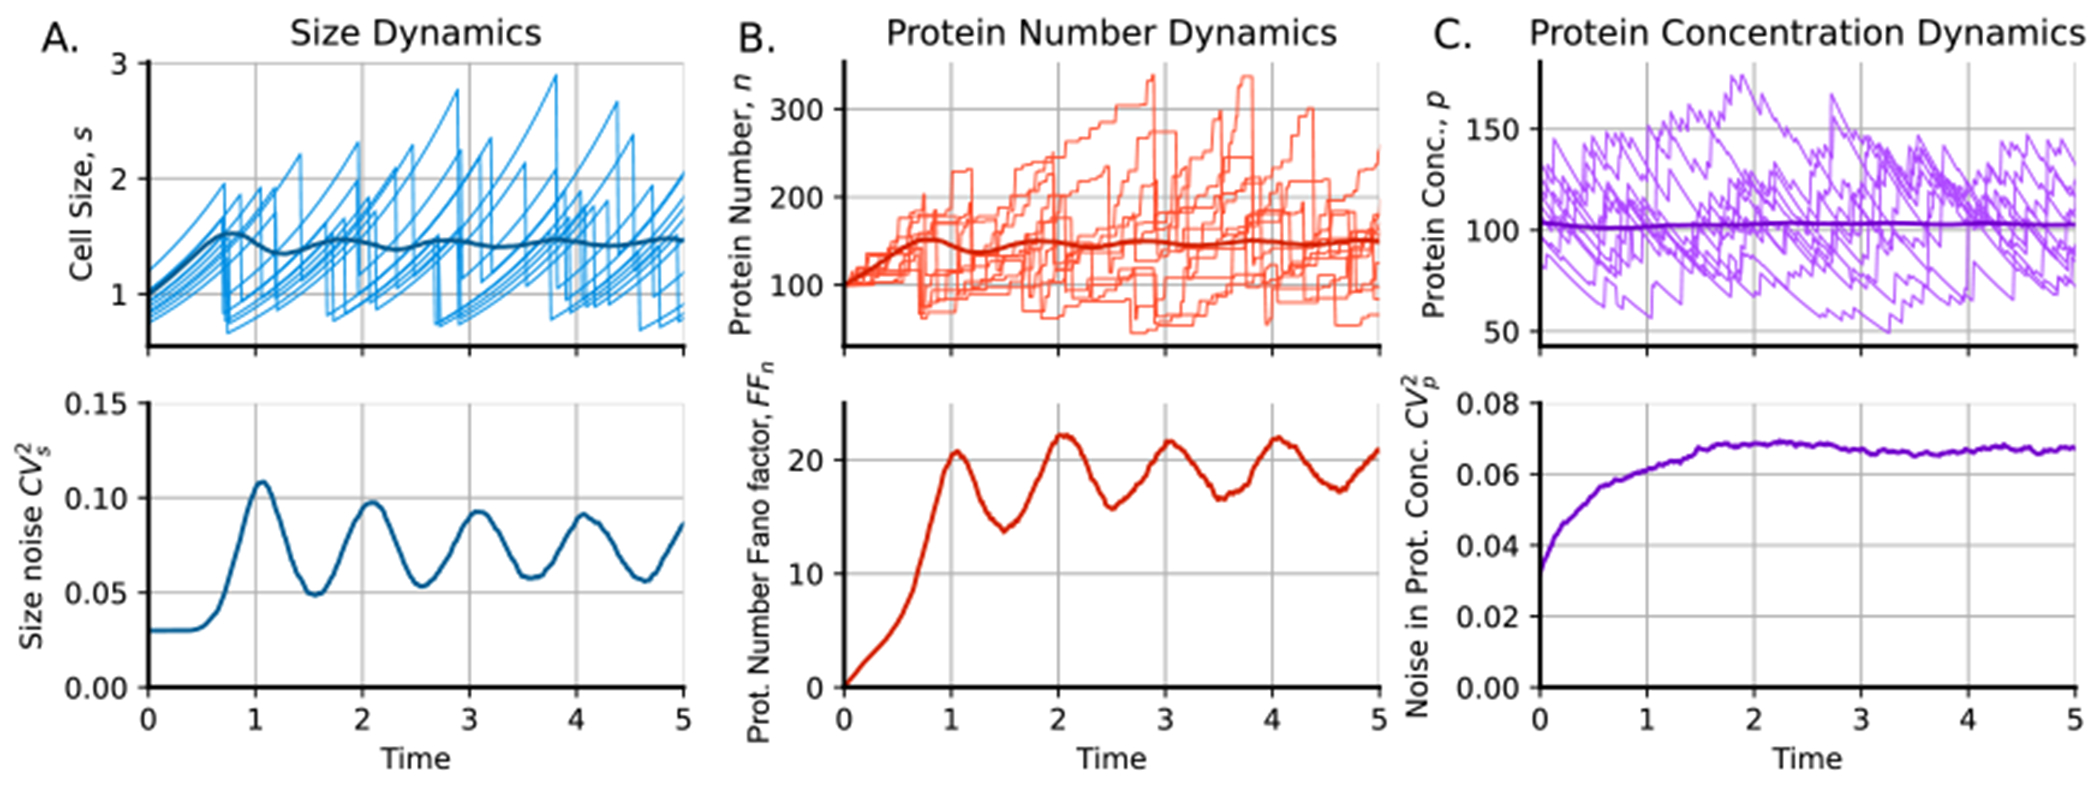
Example of gene expression trajectories including cell size dynamics. (A) Top: some cell size trajectories and mean size in darker blue. Bottom: dynamics of cell size fluctuations as the cell size squared coefficient of variation. (B) Top: some trajectories of the protein number and the mean protein number in darker red. Bottom: dynamics of the noise in protein number as the Fano factor of the protein number (variance over the mean). (C) Top: some protein concentration trajectories and mean protein concentration in darker purple. Bottom: dynamics of the noise in protein concentration as the protein concentration squared coefficient of variation. Parameters: ncells = 5000, sb = 1, gr = ln(2), steps = 10, nu = 1. The protein is produced by burst events that occur at a rate with a burst size distributed following a geometric distribution with mean .