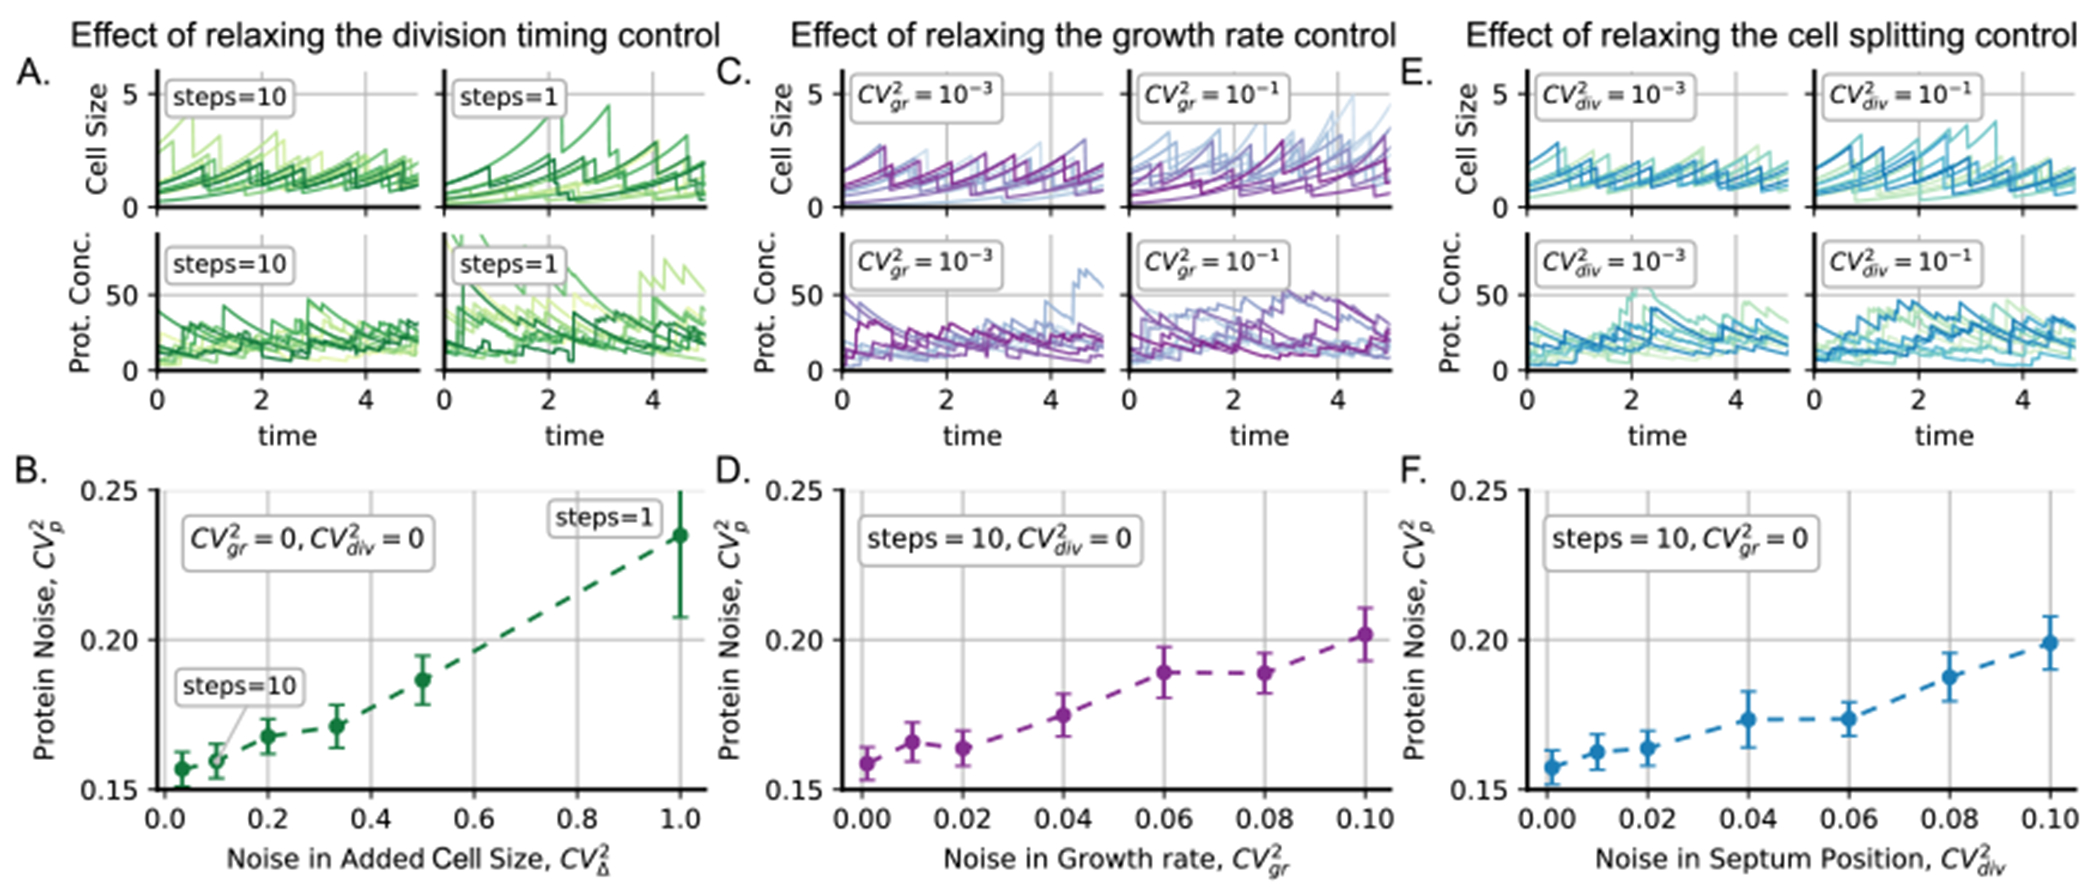
Figure 5.

Changing variables that influence noise in cell size regulation can result in variation to the level of noise in protein concentration. (A) Left: some trajectories of cell size and protein concentration for relatively regulated cell cycle timing (steps = 10). Right: trajectories of cell size and protein concentration for a less regulated cell cycle timing (steps = 1). (B) Protein noise as the squared coefficient of variation for different levels of regulation of cell cycle timing measured as the of the added size which theoretically is the multiplicative inverse of the division steps. (C) Left: some trajectories of cell size and protein concentration for relatively regulated growth rate . Right: some trajectories of cell size and protein concentration for relatively less regulated growth rate . (D) Protein noise for different levels of noise in cell growth rate. (E) Left: some trajectories of cell size and protein concentration for relatively regulated cell splitting . Right: trajectories of cell size and protein concentration for a less regulated cell splitting . (F) Protein noise for different levels of noise in cell splitting position. The protein is produced by burst events that occur at a rate with a burst size distributed following a geometric distribution with mean . Error bars represent the 95% confidence interval of the simulations using bootstrapping methods.
