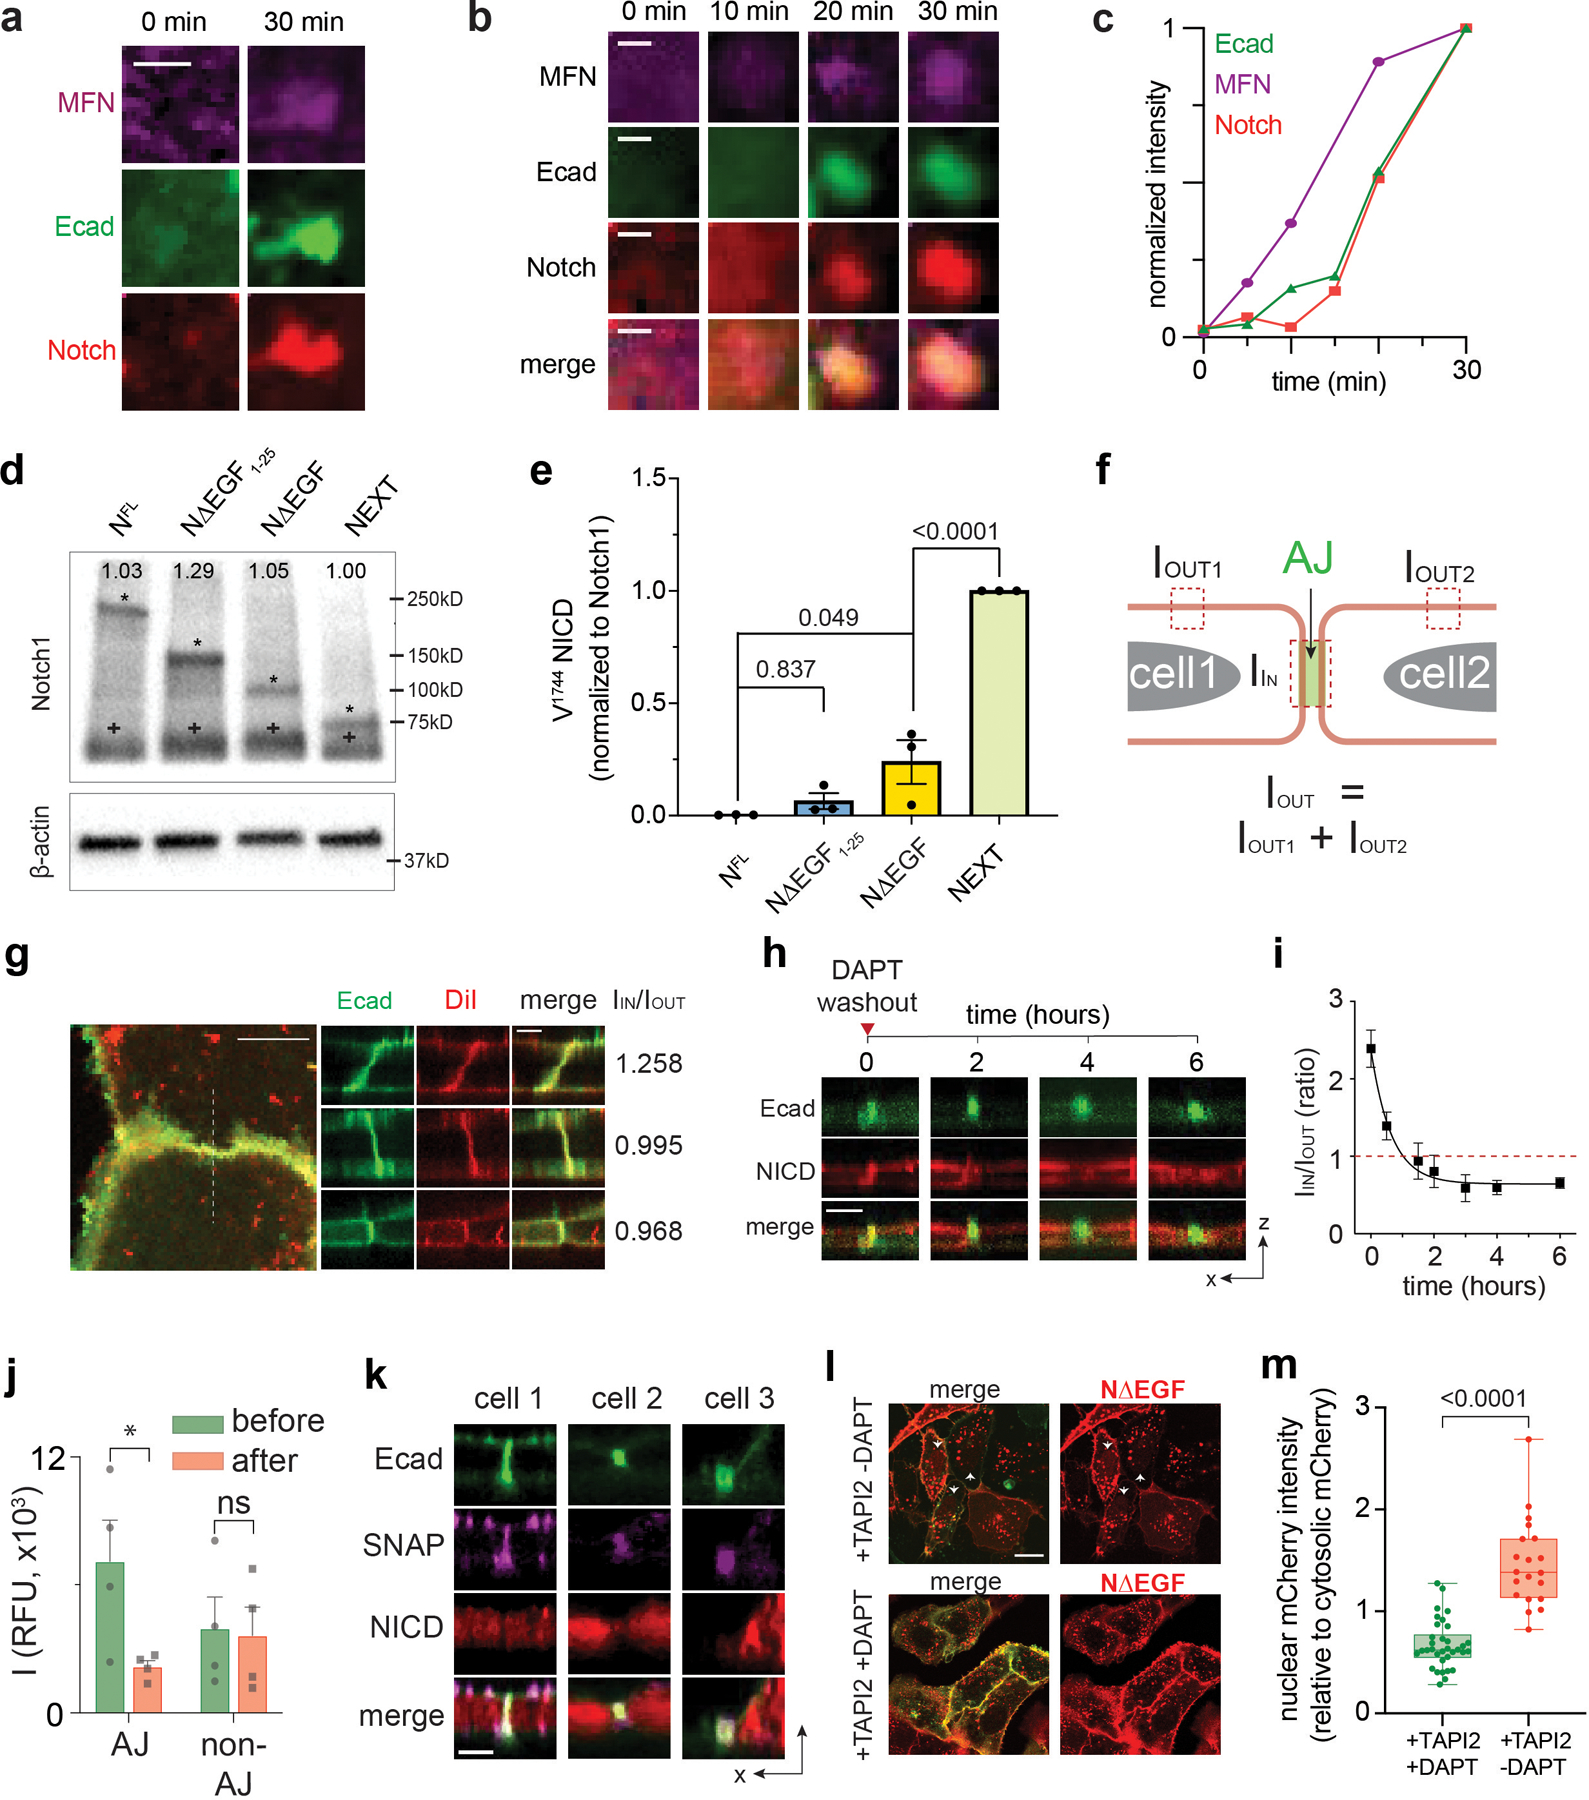
Extended Data Fig. 5. AJ-induced membrane juxtaposition drives Notch exclusion via size-dependent protein segregation.

(a) Additional artificial AJs showing Notch recruitment. Scale bar, 2 µm. (b) Time-lapse epifluorescence images (were acquired before micromagnetic tweezer (µMT) stimulation and then at 10, 20, 30 minutes of the µMT application. Gradual MFN and E-cadherin clustering was clearly seen, followed by Notch accumulation at the AJ. Scale bar, 2 µm. (c) Kinetics of signal enrichments at the artificial AJ shown in the panel (b). This is a representative result from n = 3 artificial AJs from 3 independent experiments. (d) Representative western blot for total Notch ICD from the U2OS cells stably expressing Notch1 truncation variants. The blot was probed with anti-Notch1-ICD. The same lysates were used in (Fig. 3F). The asterisk (*, upper band) represent the intact Notch truncation variants. Expected molecular weight of NFL, NΔEGF1–25, NΔEGF, and NEXT are 250 kD, 150 kD, 110 kD, and 95 kD, respectively. The cross (+, lower) represents the reduced protein band of 70 kD. All variants contain the SDS/DTT-sensitive link that produces the protein band corresponding to the polypeptide of Notch ECD and transmembrane-intracellular domain (TMICD). The number shown in each lane indicates the quantified band intensity of the corresponding lane normalized to that of NEXT variant. The intensity is calculated by summing the intensities measured from two bands detected in each lane. (e) Western blot quantification of cleaved NICD levels over total Notch levels. Data are the mean ± s.e.m. of n = 3 experiments. One-way analysis of variance (ANOVA) with Tukey’s multiple comparisons test. (f) Method to quantify Notch enrichment. Please see methods for more details. (g) Representative confocal images and enrichment factors (IIN/IOUT) of Dil membrane staining dye distribution relative to AJs. Scale bars, 10 µm (maximum intensity projection), 3 µm (z resliced images). (h) Time series of confocal z-resliced images showing the enrichment of NΔEGF (red) at the AJ (green) under DAPT treatment (t = 0), and the dissipation during DAPT washout (t ≥ 2). Scale bar, 3 µm. (i) Single-cell traces showing the time-course of the decline of NΔEGF enrichment factor at the AJs during DAPT washout (mean ± s.e.m.; n = 4 independent single-cell experiments). (j) Quantification of changes in NICD signal from these four cells at the AJs and non-AJ membrane, at t = 0 (green, before washout) and t = 6 hr (red, after DAPT washout). AJs and non-AJ membrane were detected based on thresholding and automatic segmentation using the custom-built script. Intracellular-mCherry signal significantly decreased at the AJs, but not at non-AJ membranes (*P = 0.035, ns: P = 0.075, Student’s t and Wilcoxon test, n = 4 cells examined across 2 independent experiments). (k) Confocal z-resliced images showing the distribution of extracellular SNAP (purple) and intracellular mCherry (red) tags of NΔEGF relative to AJs (green) after DAPT removal. Scale bar, 3 µm. (l, m) Nuclear location of NICD released from cell membrane that recombinantly expresses NΔEGF. (l) Confocal fluorescence images of U2OS cells expressing SNAP-NΔEGF-mCherry and Ecad-GFP. (Upper) Cells treated with TAPI2 only. White arrowheads indicate the cells with nuclear NICD-mCherry accumulation. (Lower) Cells treated with both TAPI2 and DAPT. Scale bar, 20 µm. (m) Quantification of the ratio of nucleus-to-cytosolic mCherry signals in cells with DAPT (n = 39 AJs) and those without DAPT (n = 21 AJs) from 3 independent experiments. A box and a whisker indicate the interquartile and the full range, respectively. Colored lines indicate median. Two tailed unpaired Student’s t-test.
