
Extended Data Fig. 7. Generation of U2OS SNAP-NFL-Gal4 fluorescence reporter cell lines lacking E-cadherin via CRISPR/Cas9.
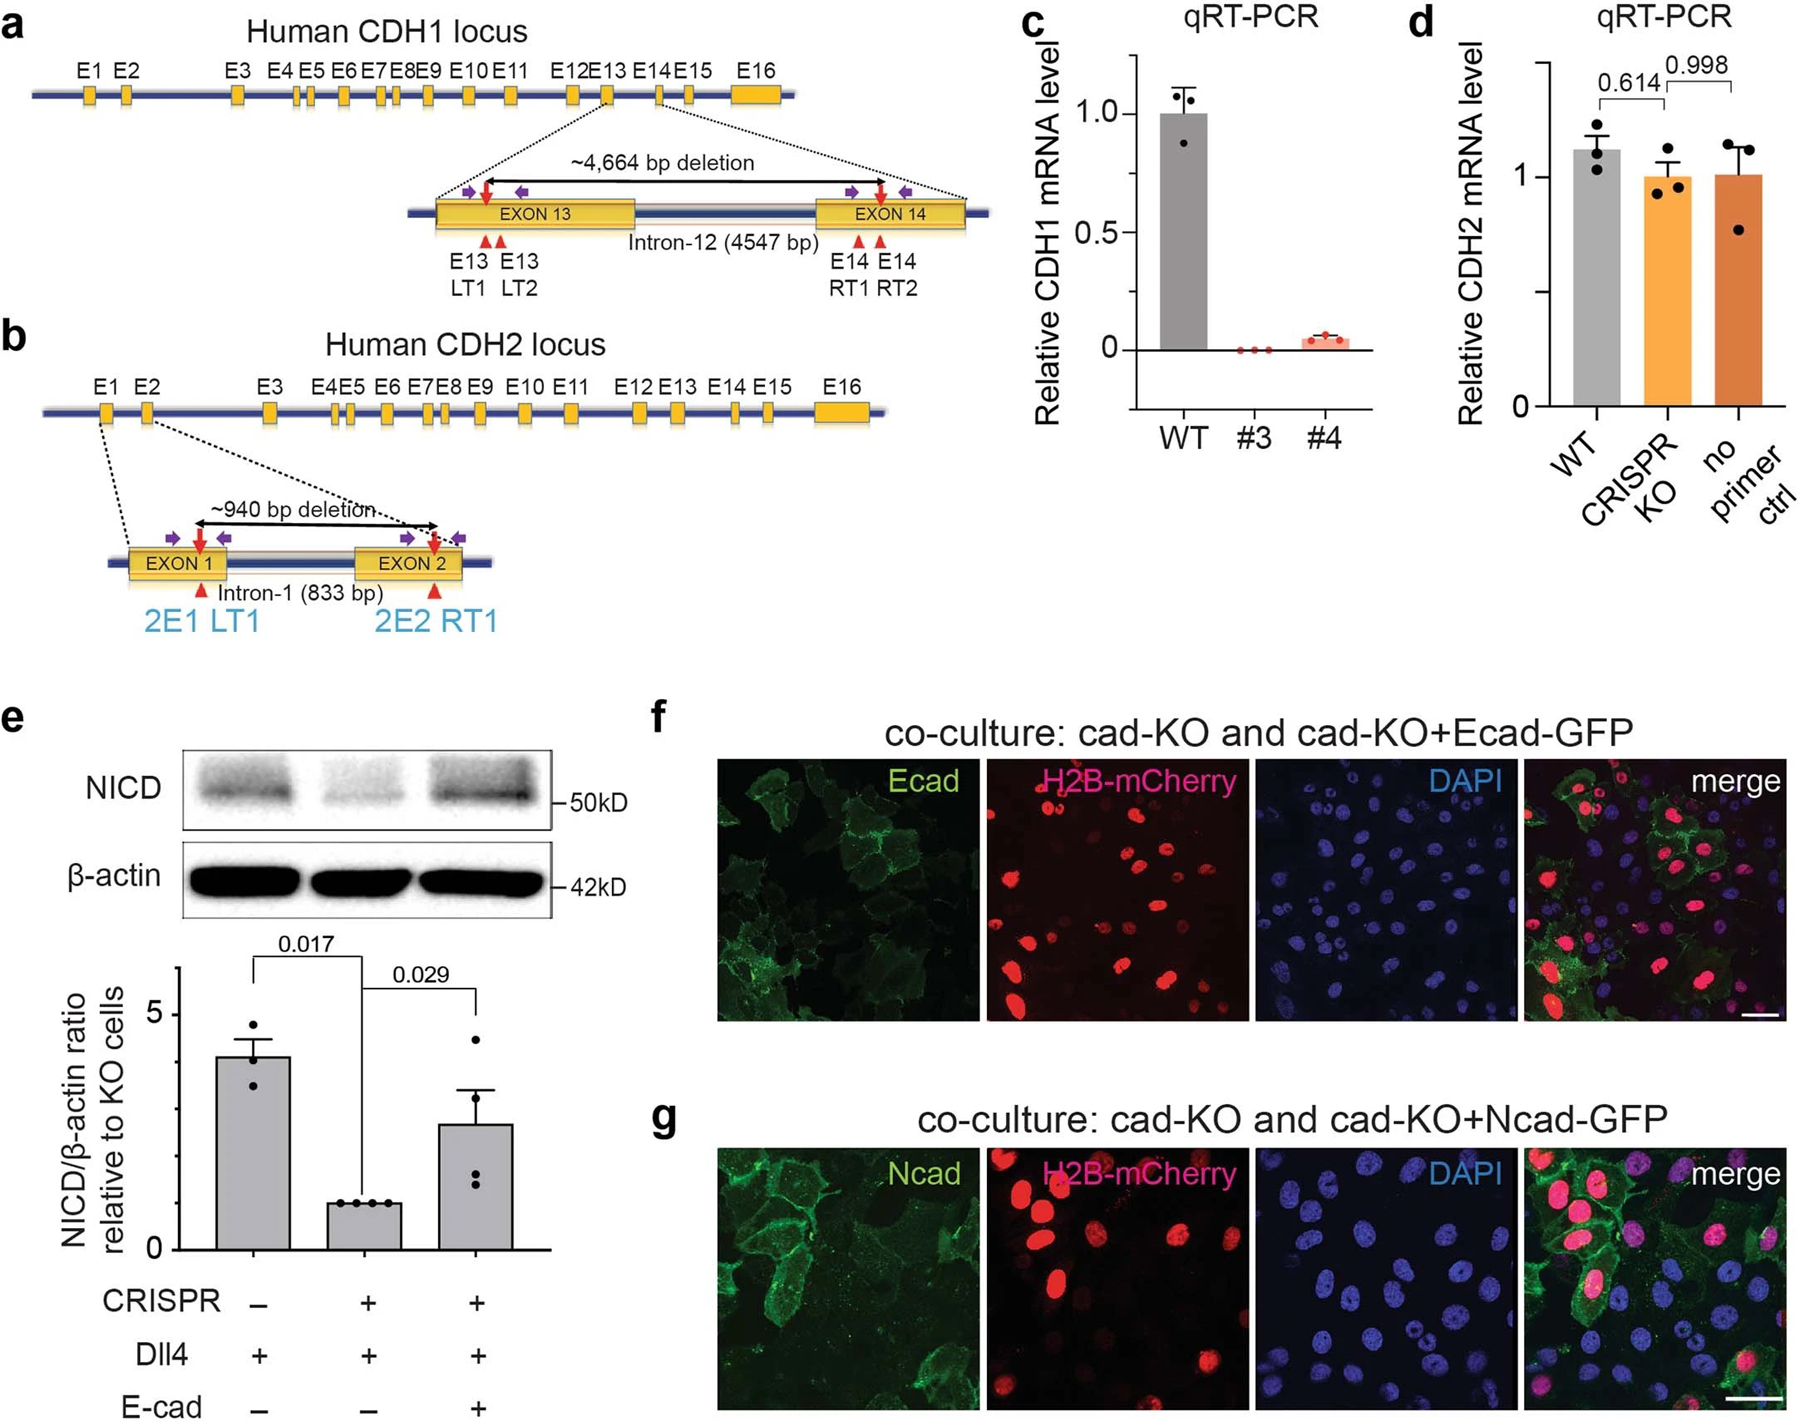
(a,b) Schematic representation of human CDH1 (a) and CDH2 (b) gene structure and targeted segmental deletion sites. The sixteen exons are shown in orange boxes (E1-E16). Red arrowheads indicate the sgRNA-binding sites (E13LT1, E13LT2, E14RT1 and E14RT2 for CDH1, 2E1LT1 and 2E2RT1 for CDH2). The targeted segmental deletions of 4.6 kb for CDH1 and 940 bp for CDH2 knockout are shown with a black line with red arrow tips, respectively. Purple arrows represent PCR primers used for the T7E1 assay and detection of alleles with targeted deletions, respectively. (c) CDH1 mRNA expression levels in CDH1 KO clone #3 and #4 were determined using qRT-PCR. CDH1 expression levels in the selected clones containing a segmental deletion were quantified relative to CDH1 mRNA levels of the wild-type U2OS SNAP-NFL-Gal4 cells. Clone #3 was used for subsequent experiments. Data are the mean ± s.d. of n = 3 biologically independent samples. (d) qRT-PCR analysis of CDH2 mRNA expression levels in U2OS SNAP-NFL-Gal4 reporter cells (WT), CDH1 KO clone #3 (Ecad-KO), and a negative control sample (no primer pair added). CDH2 mRNA levels in both WT and Ecad-KO cells were quantified relative to the negative control sample. Both WT and Ecad-KO cells showed negligible CDH2 mRNA levels, indicating that Ecad-KO cells have minimal mRNA expression of both CDH1 and CDH2. Data are the mean ± s.e.m. of n = 3 biologically independent samples; one-way ordinary ANOVA test. (e) Western blot analyses of cleaved NICD levels in the wild-type SNAP-NFL-Gal4 cells, CDH1 knock-out (Ecad-KO) cells, and Ecad-KO cells with recombinant E-cadherin transfection. (top) A representative image of immunoblotting. (bottom) Quantification of cleaved NICD levels. The average intensity of NICD bands relative to β-actin bands was quantified and then normalized to that of Ecad-KO cells. Data are the mean ± s.d. of n = 5 biological replicates; one-way ANOVA followed by Tukey’s test). (f,g) Representative epi-fluorescence images showing Notch activation in co-culture of Ecad-KO cells with Ecad-KO + Ecad cells (f) or with Ecad-KO + Ncad cells (g). Ecad-KO cells shows no GFP signal (green) while Ecad-KO + Ecad or Ecad-KO + Ncad cells show robust GFP signal indicative of reintroduction of E- or N-cadherin. Scale bar, 50 µm.