
Fig. 3. Size-dependent protein segregation from AJs exclude Notch receptors from RIP-µdomains.
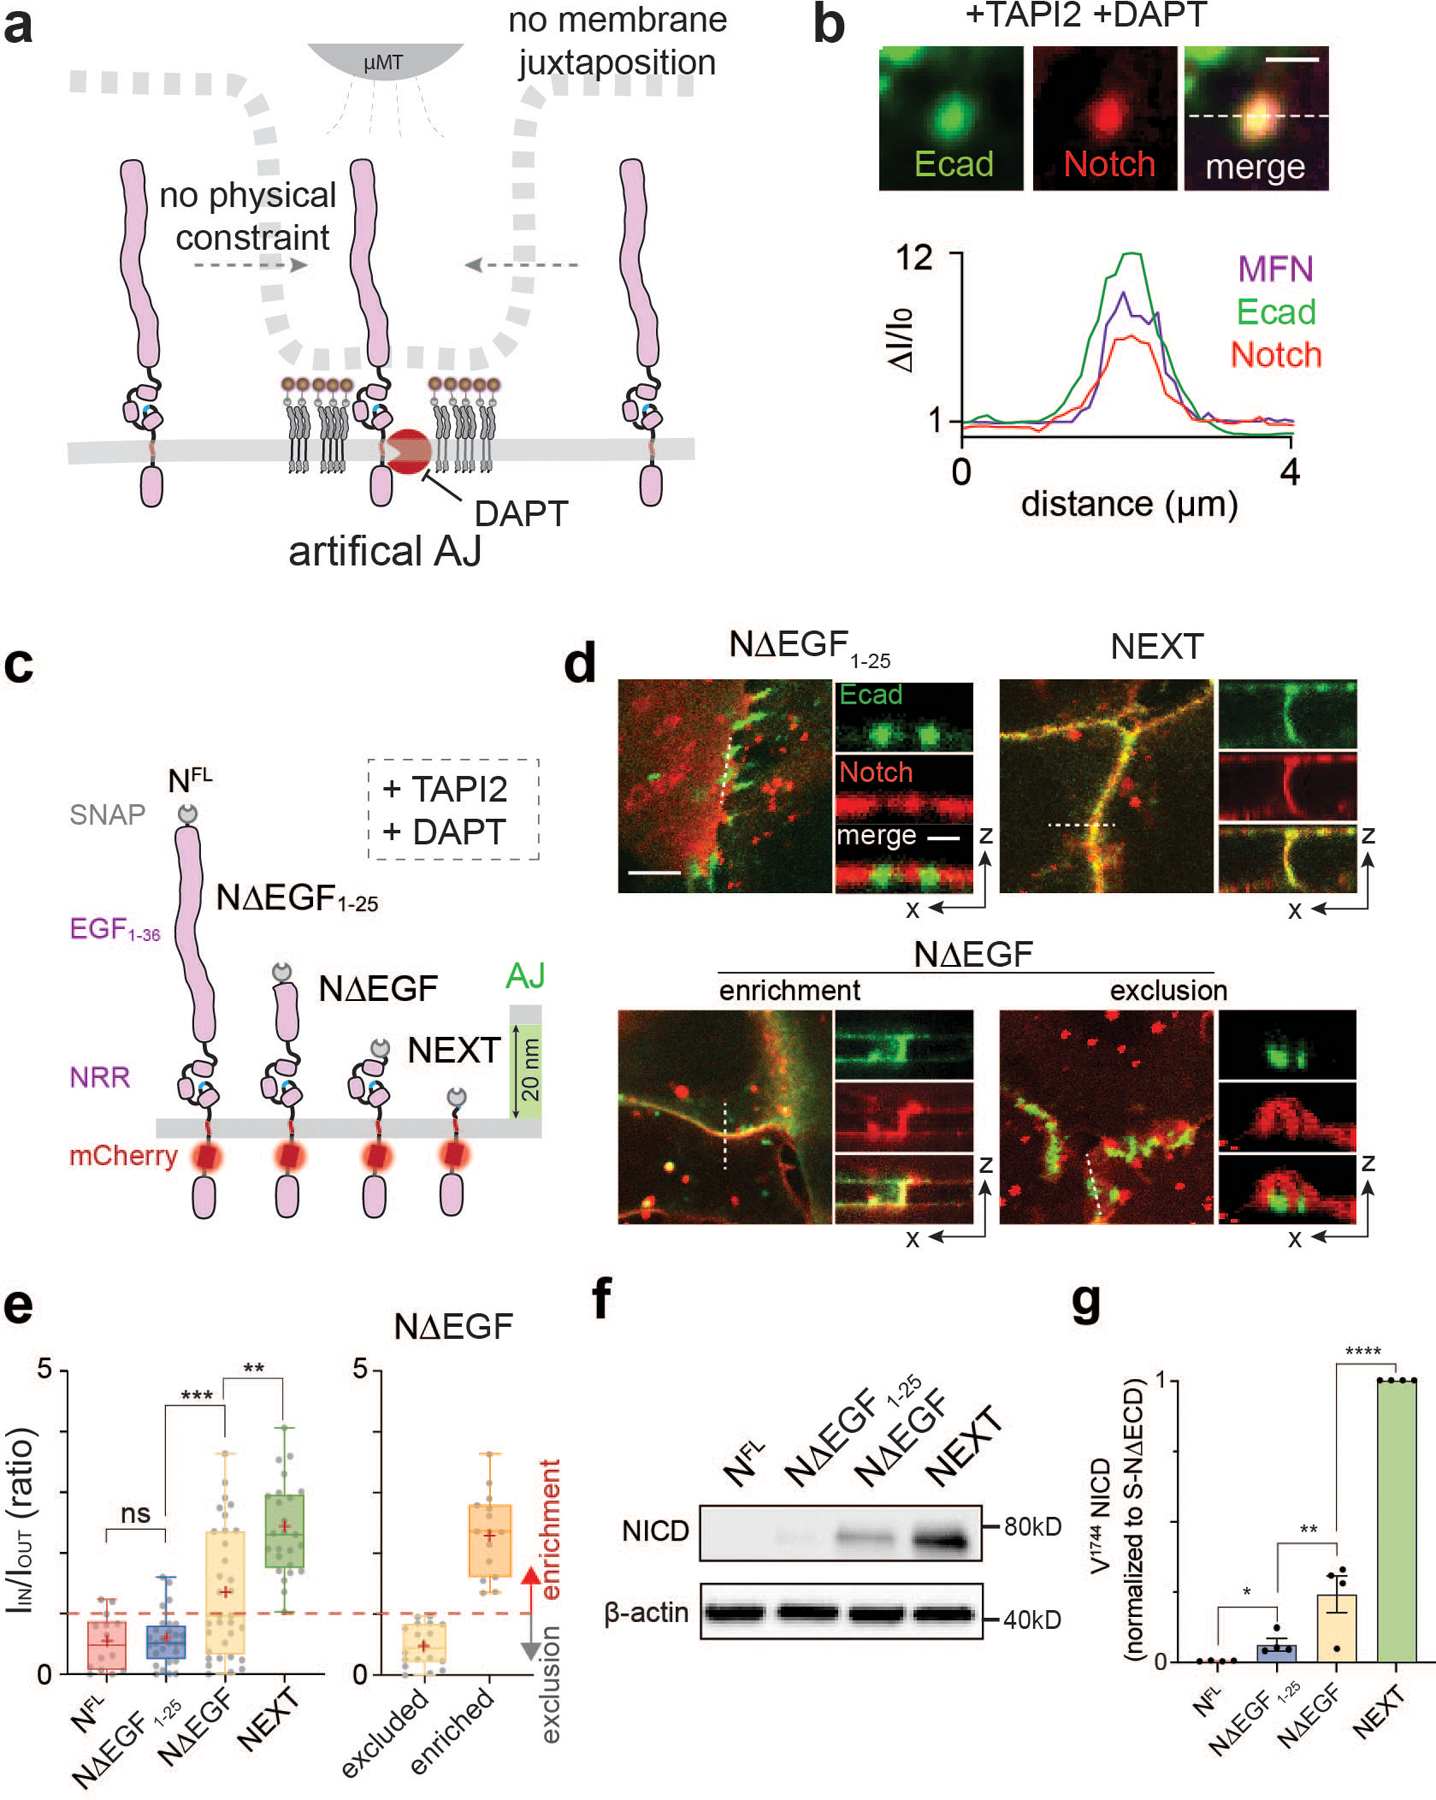
(a) A schematic showing mechanogenetic interrogation of Notch distribution relative to the artificial AJ. Cells treated with DAPT to inhibit γ-secretase activity. (b) Confocal fluorescence images showing E-cadherin and Notch distributions at the artificial AJs after µMT application. Line profiles of MFN, E-cadherin, and Notch signals along a white dashed line. ΔI/I0 represents a fold change relative to fluorescence intensity before stimulation. Scale bar, 2 µm. Shown are the representative images from n = 6 independent mechanogenetic experiments. (c) Schematics of Notch variants with different truncation lengths, in comparison with the AJ intermembrane cleft. All cells were treated with TAPI2 and DAPT to prevent any potential proteolysis. (d) Confocal fluorescence images showing spatial distribution of the Notch variants (red) relative to the AJs (green). (left) Maximum projections of confocal z-stacks. Scale bar, 5 µm. (right) Confocal z-resliced images along the white dashed lines in the maximum projection images. Scale bar, 2 µm. (e) Quantification of the enrichment factor (IIN/IOUT) of Notch variants relative to the AJs. A box-plot showing binary localization of NΔEGF which is defined as either excluded (yellow) or enriched (orange) is shown on the right. Colored lines and (+) marks indicate median and mean, respectively. The box limits indicate the 25th and 75th percentiles, and the whiskers extend to the minima and the maxima. n = (left to right) 14, 29, 33, 26, 18, and 15 cells examined over three independent experiments. ** P = 0.0002, *** P = 0.0006. (f,g) Western blot analyses of cleaved NICD levels in the cells stably expressing NFL, NΔEGF1–25, NΔEGF, and NEXT. β-actin levels represent the loading control. A representative image of immunoblotting (f), and quantification (g) of cleaved NICD levels. The average intensity of each NICD band relative to respective β-actin band was quantified and then normalized to that of NEXT. Data are the mean ± s.d. of n = 4 biological replicates. * P = 0.011, ** P = 0.041. (e,g) ****P < 0.0001, ns: non-significant; one-way ANOVA followed by Tukey’s multiple comparison test.