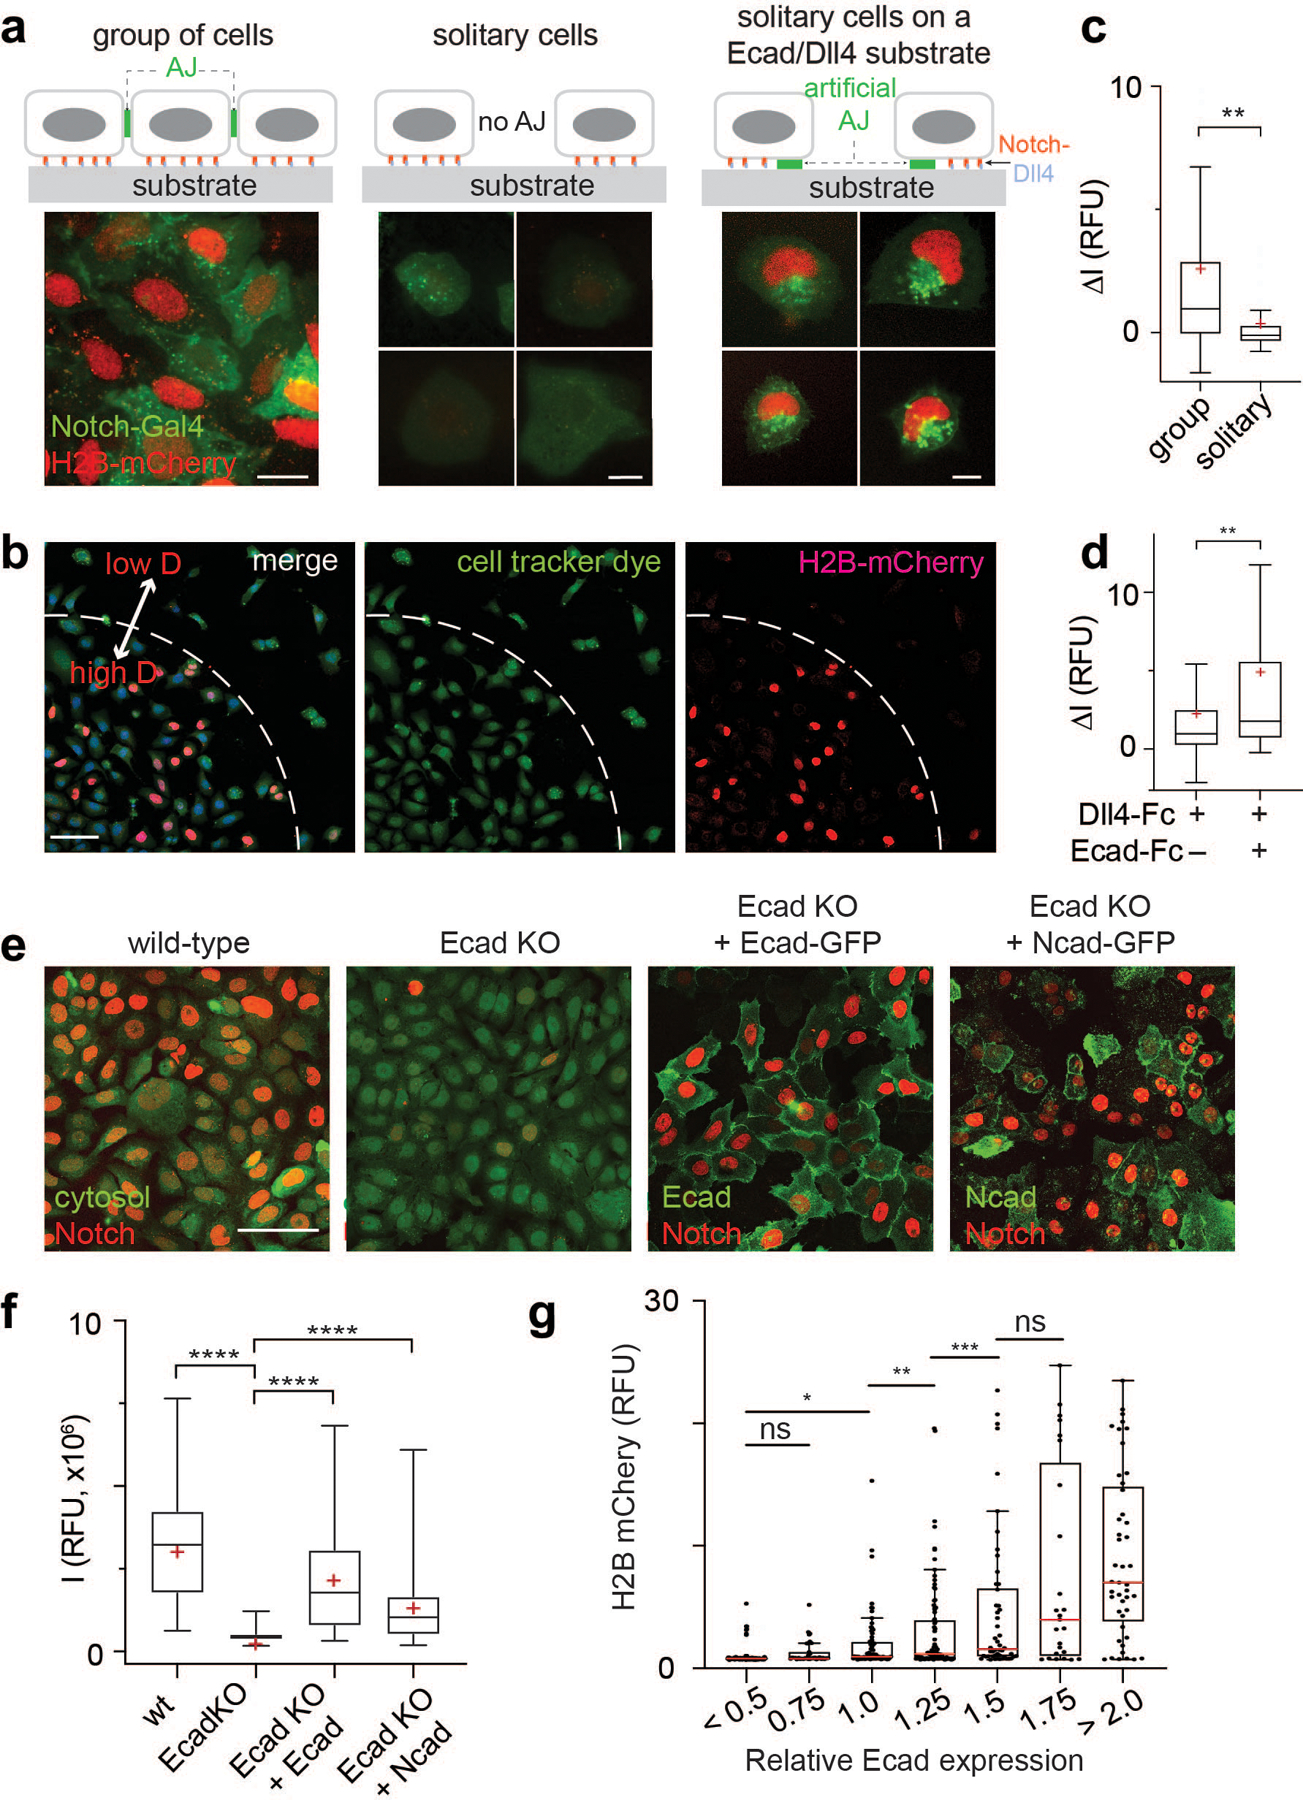
Fig. 5. The AJ-mediated spatial switch regulates Notch signaling.

(a) Representative epi-fluorescence images showing Notch activation in U2OS SNAP-NFL-Gal4 reporter cell lines in different cellular environments: Group of cells on a Dll4-Fc coated substrate (left), solitary cells with no prior contact on a Dll4-Fc coated substrate (middle), and solitary cells plated on a Dll4-Fc and Ecad-Fc coated substrate (right). Scale bars, 20 µm. (b) Representative low magnification epi-fluorescence image showing both grouped cells and multiple solitary cells. Scale bar, 100 µm. (c) Quantification of Notch activation by measuring H2B-mCherry fluorescence changes in cells within a group (n = 152 cells from 3 independent experiments), solitary cells (n = 50 cells from 3 independent experiments). ** P = 0.0034 (unpaired two-tailed Student’s t test). (d) Quantification of Notch activation in solitary cells cultured on a Dll4-Fc coated substrate and those cultured on a Dll4-Fc and Ecad-Fc coated substrate (n = 27 cells for both conditions from 3 independent experiments). ** P = 0.005 (unpaired two-tailed Student’s t test). (e) Representative confocal images of H2B-mCherry fluorescence in U2OS SNAP-NFL-Gal4 reporter cells (wt), E-cadherin knockout cells (Ecad-KO), Ecad-KO cells with recombinant E-cadherin transfection (Ecad-KO + Ecad), and Ecad-KO cells with N-cadherin transfection (Ecad-KO + Ncad). Cytosol labeled with CMFDA dye was shown for wt and Ecad-KO cells. E-cadherin and N-cadherin were shown for Ecad-KO + Ecad and Ecad-KO + Ncad cells. Scale bar, 100 µm. (f) Quantification of Notch activation in the wt (n = 86), Ecad-KO (n = 100), Ecad-KO + Ecad (n = 52), and Ecad-KO + Ncad (n = 80) cells (all pooled from 2 independent experiments). **** P < 0.0001 (ordinary one-way ANOVA followed by Tukey’s). (c, d, and f) Boxes and whiskers indicate the interquartile and full ranges, respectively. Black lines and (+) marks indicate median and mean, respectively. (g) Comparison of Notch signal activation, readout by mean nuclear H2B-mCherry fluorescence, as a function of E-cadherin expression, readout by membrane GFP fluorescence signal. Each dot represents H2B-mCherry signal of a single cell, and cells are grouped into bins based on their levels of Ecad expression. (from left to right) n = 94, 35, 71, 87, 50, 25, and 45 cells examined across two independent experiments. * P = 0.019, ** P = 0.049, *** P = 0.036, ns, non-significant (ordinary one-way ANOVA followed by Tukey’s). In the box-whisker plot, the red lines indicate median. The boxes and whiskers indicate the 25th to 75th percentiles, and the 10th to 90th percentiles, respectively.
