
Extended Data Fig. 1. Interfacial membrane compartmentalization choreographs the sequential molecular processing of Notch.
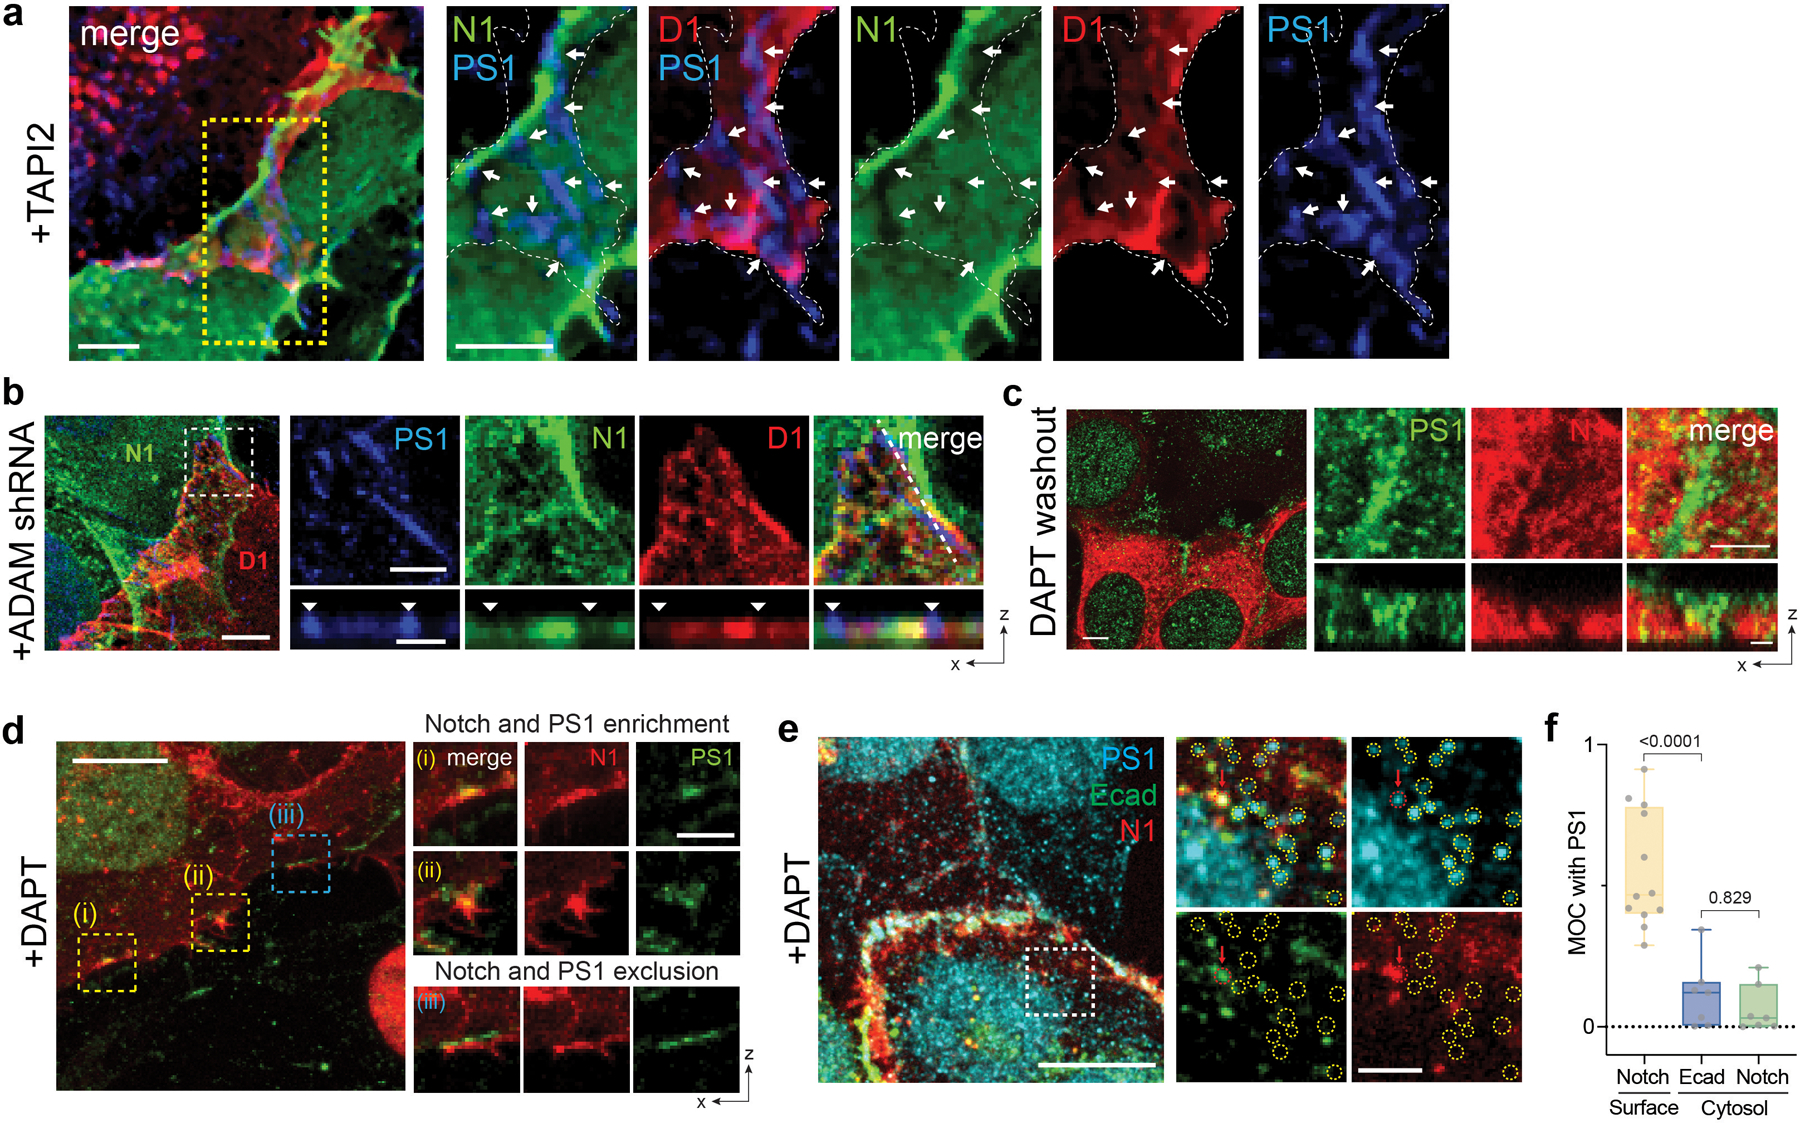
(a) Representative confocal images showing Dll1 (D1), Notch1 (N1), or presenilin1 (PS1) distributions at the interfacial junction between two cells exclusively expressing D1 or N1 in the presence of TAPI2. (left) A maximum intensity projection image of a LRE µdomains. Scale bar, 5 µm. (right) Magnified individual fluorescent channel and merged images of the yellow boxed region. The white dashed area and the white arrows indicate the cellular interface and the RIP µdomains, respectively. Scale bars, 3 µm. (b) Representative confocal images showing the interfacial junction between two cells exclusively expressing N1 and D1 in the presence of ADAM10/17 shRNA. The cell on top labeled ‘N1’ expresses N1 only, while the bottom cell labeled ‘D1’ expresses D1 only. (left) A maximum intensity projection image of a LRE µdomains. Scale bar, 5 µm. (top-right) Magnified individual fluorescence channel images of the boxed region. Scale bar, 3 µm. (bottom-right) Z-resliced images showing the sections of the cellular interfaces. Scale bar, 2 µm. (c) Representative confocal images showing N1, and PS1 distributions at the interfacial junction after washed out to remove TAPI2 and DAPT inhibition. With TAPI2 and siRNA treatment, Notch and γ-secretase compartmentalization was observed, while upon DAPT wash-out, Notch signals at the RIP µdomains disappeared. (left) A maximum intensity projection image of the cells showing enriched Notch mCherry signal at the RIP µdomains. Scale bar, 10 µm. (Top-right) Magnified individual fluorescence channel images of the boxed region. Scale bar, 2 µm. (right) Z-resliced images showing the sections of the cellular interfaces. Scale bar, 2 µm. (d) A representative confocal image showing Notch1 (N1) and presenilin1 (PS1) distribution at cellular interface. DAPT was added to inhibit S3 cleavage. (left) A maximum intensity projection image of a LRE µdomains. Scale bar, 10 µm. (right) Magnified individual fluorescent channel and merged images of the boxed region. Scale bar, 3 µm. (e) Representative confocal images showing intracellular distribution of PS1, E-cadherin (Ecad), and Notch1 (N1) in the presence of DAPT. (left) A maximum intensity projection image. Scale bar, 10 µm. (right) Magnified individual fluorescent channel and merged images of the specified intracellular region (a white dashed box). The yellow dashed circles represent intracellular puncta enriched with PS1 with no Ecad or N1 signals. The red dashed circle indicated with the red arrow represents an intracellular punctum showing all PS1, Ecad, and N1 fluorescence signals. Scale bar, 2 µm. (f) Manders’ overlap coefficients (MOCs) for quantitative assessment of PS1 with Notch1 at cell surface, PS1 with Ecad at cytosol, and PS1 with Notch1 at cytosol, respectively. Each dot represents the MOC of a selected cell surface or cytosol. In the box-whisker plot, the boxes show the 25th to 75th percentiles, and the whiskers extend to the maxima and the minima. Solid lines indicate median, respectively. n = 12 (Notch1 at surface), 7 (Ecad in cytosol), and 7 (Notch1 in cytosol) biologically independent cells across 2 independent experiments; ordinary one-way ANOVA with Tukey’s multiple comparison testing.