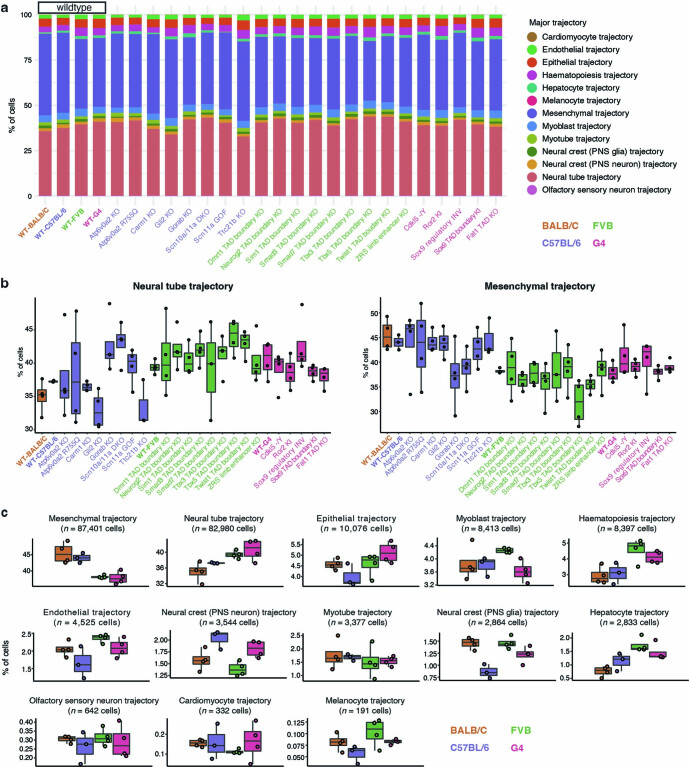
Extended Data Fig. 3. Cell composition for individual wildtype and mutant embryos across developmental trajectories.
a, Cell composition across 13 major trajectories of embryos from different wildtype or mutant strains. Cells from all replicates for each strain were pooled for this visualisation. The adjusted p-value by Chi-squared test on cell compositions for individual mutant type and its corresponding genetic background wildtype has been added above. b, Boxplots of cell proportions falling into neural tube (left) or mesenchymal (right) trajectories for different wildtype or mutant strains. Points correspond to individual embryos (n = 3 for WT-C57BL/6, n = 4 for all others). c, Boxplots of cell proportions falling into each of the 13 major trajectories for the four wildtype strains. Each point corresponds to an individual embryo. The total number of cells from each major trajectory profiled from wildtype embryos and the adjusted p-value by ANOVA (two-sided test) across different backgrounds are also listed. In the boxplots (panels b & c), the centre lines show the medians; the box limits indicate the 25th and 75th percentiles; the replicates are represented by the dots. PNS: peripheral nervous system.

