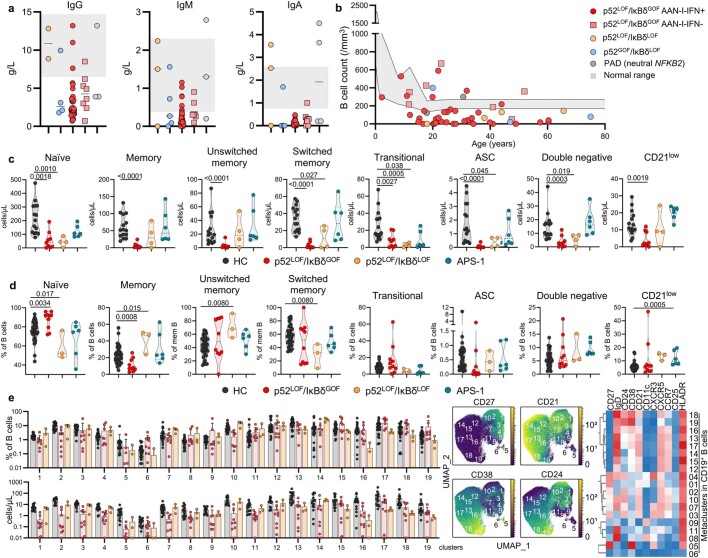
Extended Data Fig. 6. Immunoglobulin level and B cell immunophenotyping of patients with inborn errors of NF-κB2.
(a) Immunoglobulin IgG, IgM, and IgA levels (g/L) in patients with inborn errors of NF-κB2. Normal immunoglobulin distribution corresponds to the grey area. Bars represent the median values. (b) B cell count across ages in patients with p52LOF/IκBδGOF variants with (n = 39, red dots) and without (n = 7, red squares) AAN-I-IFNs, patients with p52LOF/IκBδLOF/WT (n = 3, orange dots), p52GOF/IκBδLOF/WT (n = 4, blue dots), or neutral (PAD, grey dots) NF-κB2 variants. Normal B-cell count for age corresponds to the grey area. (c) Cell numbers among B cell subsets, as determined by CyTOF, in healthy donors (n = 15, black dots), patients with p52LOF/IκBδGOF variants aged ≥ 6 years (n = 9, red dots), patients with p52LOF/IκBδLOF variants (n = 4, orange dots), and APS-1 patients (n = 6, green dots). (d) Proportions of B cell subsets, as determined by CyTOF, in healthy donors (n = 15, black dots), patients with p52LOF/IκBδGOF variants (n = 10, red dots), patients with p52LOF/IκBδLOF variants (n = 3, orange dots), and APS-1 patients (n = 6, green dots). B-cell subset proportions from a patient with a p52LOF/IκBδLOF R52*/WT variant are not shown due to his lack of circulating B cells. (e) Proportions of B cell subsets and absolute counts of B cells identified in the 19 metaclusters in healthy donors (n = 22, black dots), patients with a p52LOF/IκBδGOF variant aged ≥ 6 years (n = 9, red dots), and patients with a p52LOF/IκBδLOF variant (n = 3, orange dots) (left panels); representation of the CD27, CD21, CD38, and CD24 markers on UMAP (middle panels); heatmap showing the mean levels of the surface markers included in the clustering defining 19 distinct metaclusters. The error bars represent the mean values (± s.d.) of each group.

