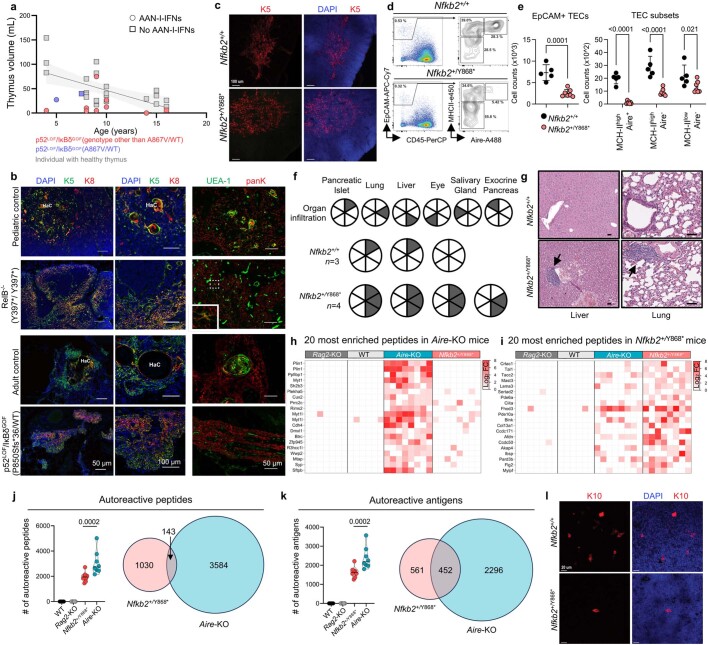
Extended Data Fig. 10. Thymus volume in p52LOF/IκBδGOF children, and autoimmune pathology and autoreactive IgG profiles in Nfkb2+/Y868* mice.
(a) Estimation of thymus volume in p52LOF/IκBδGOF patients relative to aged-matched controls aged from 3 to 16 years. Black line represents simple linear regression of the control thymus volume with its 95% confidence bands (grey area). Data representative of one independent experiment are shown. (b) Immunofluorescence staining of thymic tissue from age-matched controls and patients with AR complete RelB deficiency or a p52LOF/IκBδGOF variant. HaC, Hassall’s corpuscles. Scale bars, 50 μm (left and right panel) or 100 μm (central panel). (c) Representative confocal microscopy images of the thymic medulla stained for cytokeratin 5 (K5) for the WT controls (Nfkb2+/+, n = 3) or Nfkb2+/Y868* mice (n = 3). Scale bar, 100 μm. Data representative of two independent experiment are shown. (d) Contour plot for Aire expression in mature MHC-II+ mTECs. (e) Absolute number of EpCAM+CD45- thymic epithelial cells (TECs), and TEC subsets in Nfkb2+/+ (n = 5) and Nfkb2+/Y868* (n = 7) mice. Comparisons done using unpaired, parametric, two-tailed Student’s t-test (for EpCAM+ TECs) or two-way non-parametric ANOVA (Sidak’s test) with correction for multiple comparisons (for TEC subsets). Three independent experiments were performed. (f) Summary of lymphocytic cell infiltrates in Nfkb2+/+ (n = 3) and Nfkb2+/Y868* (n = 4) mice. Each circle represents an individual animal, and each slice of the circle represents a tested organ. Lymphocytic infiltrates of the designated organ are indicated by the grey-shaded sections of the circle. One independent experiment was performed. (g) Representative tissue sections stained with hematoxylin and eosin (H&E) showing lymphocytic infiltrates (black arrows) in Nfkb2+/+ or Nfkb2+/Y868* mice. Scale bar, 50 μm. Data representative of one independent experiment are shown. (h-i) Heatmap of the top 20 autoreactivities by degree of enrichment, in Aire-KO (h) or Nfkb2+/Y868* (i) mice relative to WT and Rag2-KO mice. (j-k) Number of autoreactive peptides (j) or antigens (k) displaying enrichment in WT, Rag2-KO, Nfkb2+/Y868* and Aire-KO mice, and representation of the autoreactive peptide and antigen profiles of Nfkb2+/Y868* and Aire-KO mice, with their overlap. Comparisons done using two-tailed Mann–Whitney test. (l) Representative confocal microscopy images of K10 and DAPI staining on Nfkb2+/+ (n = 3) and Nfkb2+/Y868* (n = 3) mouse thymuses. Scale bars, 20 μm. Data representative of two independent experiments are shown.

