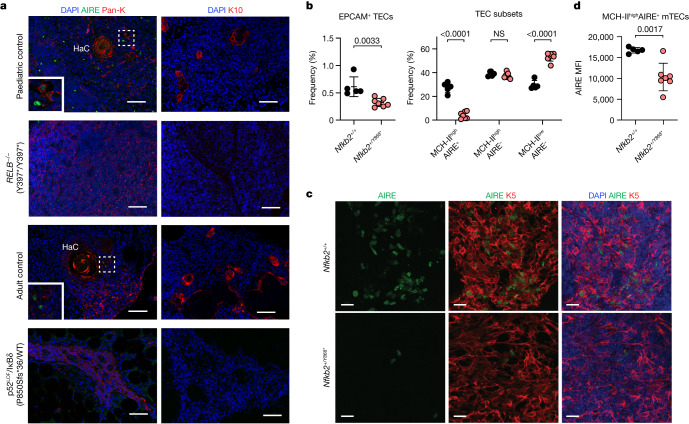
Fig. 5. Impaired mTEC development and thymic AIRE expression in a patient with autosomal-recessive RELB deficiency, a patient heterozygous for a p52LOF/IκBδGOF NF-κB2 variant and in mice heterozygous for the Y868* NF-κB2 variant.
a, Immunofluorescence staining of thymic tissue from age-matched controls, a patient with autosomal-recessive complete RELB deficiency or heterozygous for a p52LOF/IκBδGOF NF-κB2 variant. AIRE-expressing cells (green) and Hassall’s corpuscles (HaC) are shown on the left. Pan-K, pan-keratin. Staining for K10 (red), defining terminally differentiated corneocyte-like mTECs, is shown on the right. DAPI staining is shown in blue. Scale bars, 50 μm (left) and 100 μm (right). Inset: the controls at a higher magnification. Data shown are representative of one independent experiment. b, The percentage of EPCAM+CD45− thymic epithelial cells (TECs), and the various TEC subsets (defined on the basis of their MHC class II (MHC-II) and AIRE expression) in WT controls (Nfkb2+/+, black dots, n = 5) and mice carrying a heterozygous missense variant homologous to the human Y868* p52LOF/IκBδGOF NF-κB2 variant (Nfkb2+/Y868*, red dots, n = 7). Statistical comparisons were performed using unpaired, parametric, two-tailed Student’s t-tests (EPCAM+ TECs) or two-way nonparametric analysis of variance (ANOVA) (Sidak’s test) with correction for multiple comparisons (TEC subsets). Data are mean ± s.d. Data shown are representative of three independent experiments. c, Representative confocal microscopy images of AIRE (green), K5 (red) and DAPI (blue) of WT (Nfkb2+/+, n = 3, top) and Nfkb2+/Y868* (n = 3, bottom) mouse thymuses. Scale bars, 20 μm. Data shown are representative of two independent experiments. d, Mean fluorescence intensity (MFI) of AIRE expression in mature MHC-IIhighAIRE+ mTECs from WT (n = 5) and Nfkb2+/Y868* (n = 7) mouse thymuses. Statistical comparisons were performed using unpaired, parametric two-tailed Student’s t-tests. Data are mean ± s.d. Data shown are representative of three independent experiments.

