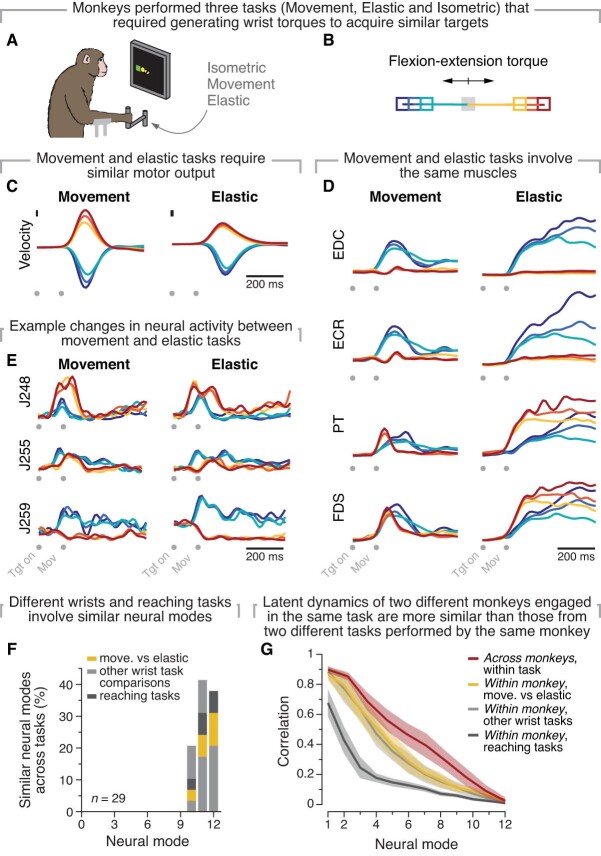
Extended Data Fig. 9. The latent dynamics of two different monkeys performing the same task are more preserved than those of the same monkey performing two related tasks.
A) We compared the latent dynamics produced by monkeys performing three related visually-guided one-dimensional wrist manipulation tasks using the same manipulandum. We also compared two reaching and grasping tasks (details in ref. 33). B) The organization of the targets and the produced cursor trajectories were the same across all three wrist manipulation tasks (note the overlapping cursor trajectories). C–E) Here, we show behavioural and neural data from the two wrist manipulation tasks that had the most similar kinematics ((C); lines colour coded by targets according to (B)): the one-dimensional movement task and the one-dimensional spring-loaded (‘elastic’) movement task. These two tasks engaged the same muscles (D) and the activity of single units was also relatively similar across them ((E) shows three example units). F) The covariance patterns elicited by these tasks as well as the rest of wrist and reaching tasks was also quite similar across behaviours (this figure shows the number of neural modes out of twelve that are well-aligned across tasks according to a principal angle analysis). G) Despite the similarities in task characteristics (B), motor output (C), engaged muscles (D) and even single unit tuning (E), the latent dynamics generated by the same monkey as it performed different wrist tasks (mustard and light grey) or different reaching task (dark grey) within the same day were less similar than those of two different monkeys engaged in the same task (red). The across monkey results (red) illustrate preservation of the latent dynamics as monkeys performed the same centre-out reaching task; the results are the same as in Fig. 2e only recalculated with 12 components to match the across-task analysis in Gallego et al. 33 Lines and shaded area, mean ± s.d. across the comparisons indicated in the legend. (A-F) are adapted from ref. 33; the across-task alignment data in (G) partly reproduces Supplementary Fig. 7 therein.

