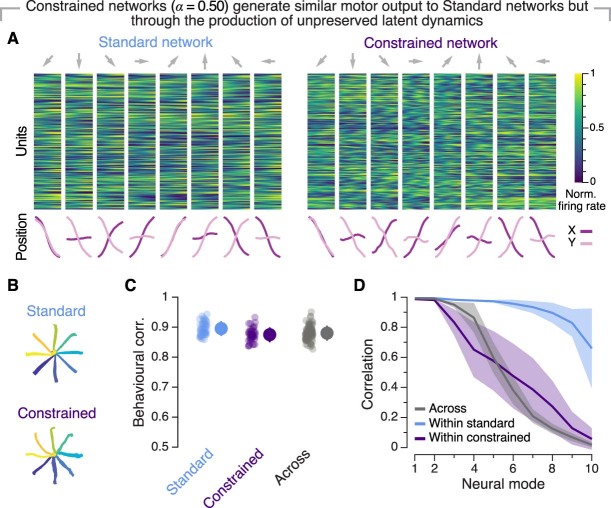
Extended Data Fig. 10. Additional data on recurrent neural network models.
A) Behavioural output and network dynamics for each reach direction for example Standard (left) and Constrained (right) networks that were penalized for canonical correlation similarity to the latent dynamics of Standard networks. Results presented as in Fig. 2b. Data for constrained networks represents results for α = 0.50. B) Behavioural output produced by the two types of RNNs. The Standard (top) and Constrained (bottom) networks produce similar output. C) Behavioural correlation within and across pairs of Standard and Constrained networks. Data show 10 networks initialized from different random seeds for each type of network, 45 comparisons within network types, 100 comparisons across network types. Markers, individual comparisons. Error bars, mean ± s.d. D) Similarity in latent dynamics between pairs of Standard networks (blue) and Constrained networks (purple) and across network types (grey). Note that Constrained networks have correlations that are much more dissimilar than Standard networks. Likewise, the correlation between the latent dynamics of pairs Standard and Constrained networks are much lower than those between pairs of Standard networks. Thus, behavioural similarity is not sufficient to obtain highly correlated latent dynamics. Line and shaded area, mean ± s.d.

