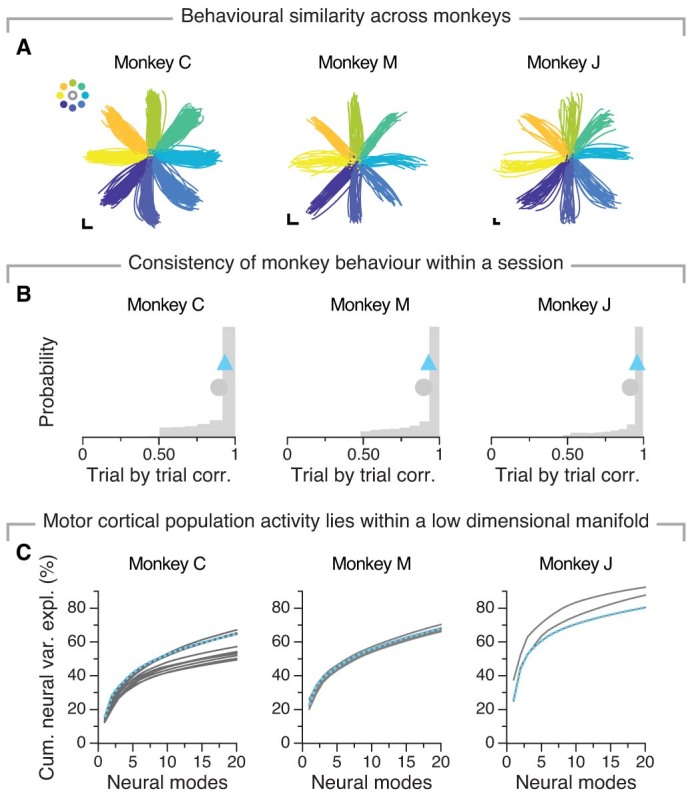
Extended Data Fig. 1. Behavioural and neural data from monkeys performing a centre-out reaching task.

A) Hand trajectories of a single session of every monkey included in this work. Each line represents one trial, colour coded by target (inset). Scale bar, 1 cm. B) Distribution of the behavioural correlations for all pairs of trials from every included session for each of the three monkeys. Grey circle, mean. Blue triangle, mean for the representative session shown in (A). C) Cumulative neural variance explained as a function of the number of neural modes included. Data include 12 sessions for monkey C, 6 sessions for monkey M and 3 sessions for monkey J. Each line, one session. Dashed blue line, the same session shown in (A).
