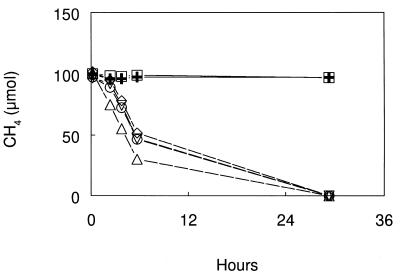
FIG. 2.
Recovery of methane oxidation by cell suspensions of M. capsulatus after exposure to inhibitors for 4.5 h and removal of inhibitors at 30°C. Symbols: ▵, no additions; ○, 0.1 kPa of DFM added; ▿, 1.0 kPa of DFM added; ◊, 1.0 kPa of MeF added; □, 1.0 kPa of C2H2 added; + heat killed. Symbols represent the mean of three cultures, and the error was smaller than the symbol size.

