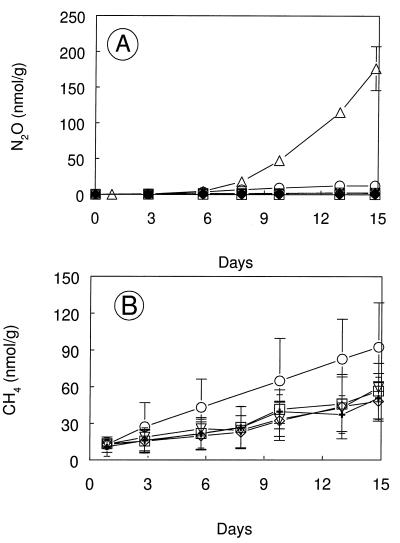
FIG. 6.
Production of N2O (A) and CH4 (B) during aerobic incubations of Searsville Lake soil with 40 μmol of added NH4Cl g−1. Symbols: ▵, no additions; ○, 0.01 kPa of DFM added; ▿, 0.03 kPa of DFM added; ◊, 0.05 kPa of DFM added; □, 1.0 kPa of DFM added; +, 2.0 kPa of C2H2 added. No CH4 measurements were made for the case of no additions. Error bars indicate ±1 standard deviation of the mean of three soil samples. The absence of error bars indicates that the error was smaller than the symbol size.

