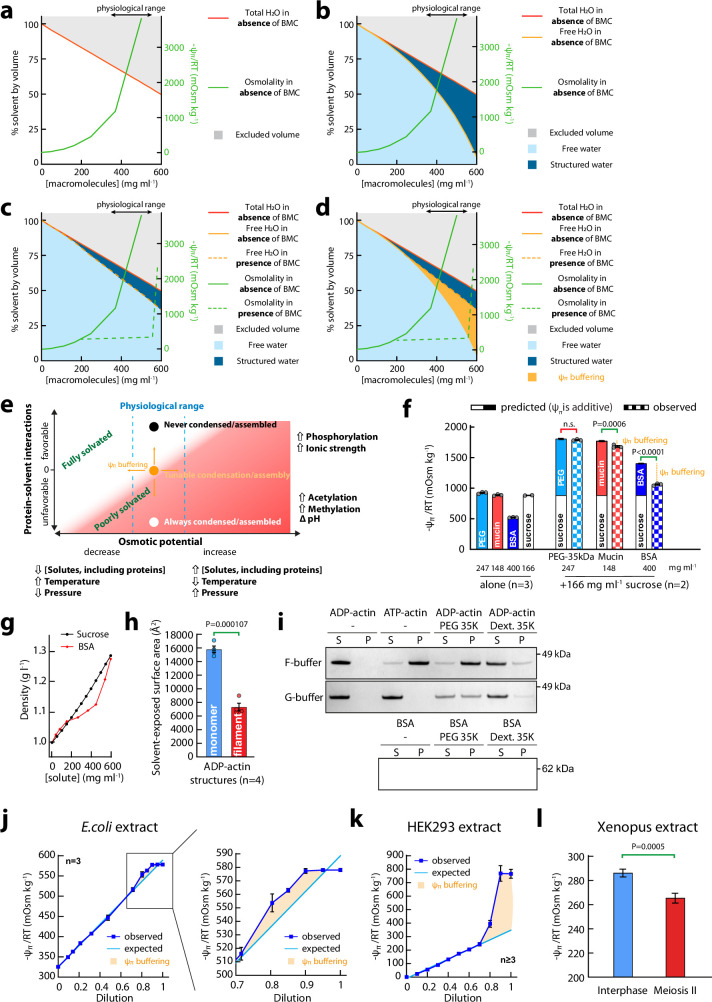
Extended Data Fig. 10. Osmotic potential buffering by proteins in cells.
(a) The relationship between macromolecule concentration, excluded volume and osmotic potential for PEG-20kDa as a model protein is shown, incorporating direct measurements99. (b) The proportion of structured water was estimated by assuming 2373 water molecules per molecule of PEG, equivalent to a hydration shell that extends ~1 nm from each macromolecular surface100, and that each water molecule can be either free or structured at any moment. (c) Dotted lines represent a qualitative approximation of the predicted effect of biomolecular condensation (BMC) on the system. In this case, the relative favourability of solute-solute over solute-solvent interactions increases with osmotic potential. The result is that condensation increases more gradually as the concentration of macromolecules increases compared with if all macromolecules remained fully hydrated. (d) The difference in how free H2O (and osmotic potential) change as a function of [macromolecules] due to condensation is represented, i.e., the proportion of structured water in cells changes quite modestly over the physiological range of [macromolecules] due to a progressive increase in solute-solute interactions. Please note that, in modelling the colloidal osmotic potential of the cytosol, we use PEG to approximate the consequence of every macromolecular surface being solvent-exposed, where cytosol normally contains at least 350 mg ml−1 protein (equivalent to >3 moles l−1 of free amino acids). In these calculations, however, we do not consider any other osmolyte. This is obviously a simplification, since cytosol also contains >150 mM small osmolytes. This would further increase the >2000 mOsm kg−1 that would be expected if the cytosol were composed from PEG by at least an additional 150 mOsm kg−1 (osmolytes follow the van’t Hoff equation, unlike non-ideal proteins). This further illustrates how cells achieve the measured, physiological osmotic potential of the cytosol (~300 mOsm kg−1), by folding macromolecules and assembling them into higher order structures and condensates that minimize their total solvent-accessible surface area. In other words, buffering of intracellular water potential through macromolecular assembly and condensation is the only way such a high concentration of heterogeneous proteins can be maintained whilst remaining enzymatically active. Our observations in this investigation simply suggest that, for some proteins, the free energy difference between condensation and full hydration is so close to zero that they function as buffers of water potential upon physiologically-relevant challenge. (e) Whether by complex assembly or biomolecular condensation, the osmotic potential at which any given protein partakes in homo- or heterotypic interactions with other macromolecules depends on the favourability of its interactions with H2O, and so is sensitive to factors that affect Ψπ (x-axis). Protein-solvent interactions can be modulated by changes in surface electrostatics (y-axis), through phosphorylation38,63 or histidine protonation57, for example. (f) Osmotic potential buffering by macromolecular phase separation. The osmotic potential of indicated mixtures of macromolecules was determined at 27 °C and compared to their expected values (sum of the osmotic potential of the constituents). Statistics: two-way ANOVA followed by Šídák’s post-hoc test (P value indicated, n: number of repeats). Compared with PEG, which does not phase separate (see Fig. 4a), intermediate concentrations of BSA effectively ‘buffer’ the osmotic potential of the solution against a further increase in osmotic potential (also seen with Mucin to a lower extent). (g) Density of BSA and sucrose solutions at indicated concentration. (h) Comparison of solvent-exposed surface (mean ± SEM) between filamentous and monomeric ADP-actin. Statistics: paired t-test comparing ADP-actin structures available in the PDB (n = 4, pdb codes 4A7N, 5ONV, 7BT7, 8A2Z). (i) Top two panels: Actin pelleting assay in indicated buffer conditions using 0.7 µM actin, which is above the Critical concentration (Cc) for ATP-actin, but below that of ADP-actin. As a negative control, the same pelleting assay was performed with 0.7 µM BSA in F-buffer (bottom panel). Depleting free water by addition of PEG triggers ADP-actin polymerization below the Cc. This is not a simple crowding effect, as it is not observed with dextran of the same size at the same concentration, (see Extended Data Fig. 1h). Note that the effect is observed in both G- and F-buffer, albeit to a lower extent in G-buffer. (j) left: Osmotic potential of dilution series with extracts from E. coli Right: magnified view of inset in left panel (mean ± SEM; n: number of independent dilution series). (k) Osmotic potential of dilution series with neat extract of HEK293 cells (mean ± SEM; n: number of independent dilution series). (l) Osmotic potential of cell-cycle arrested xenopus extracts measured at indicated point of the cell cycle (mean ± 95% Confidence Interval). To ensure precise measurements, a dilution series was measured, and the linear part of this curve was used to estimate the value of the undiluted extract (see methods). Statistics: Welch t-test (n = 2 dilution series per condition with at least 7 datapoints per dilution series). Note that panels (j,k) and all other such measurements in this manuscript were obtained by vapour-pressure osmometry, while panel (l) was measured by freezing-point-depression osmometry.

