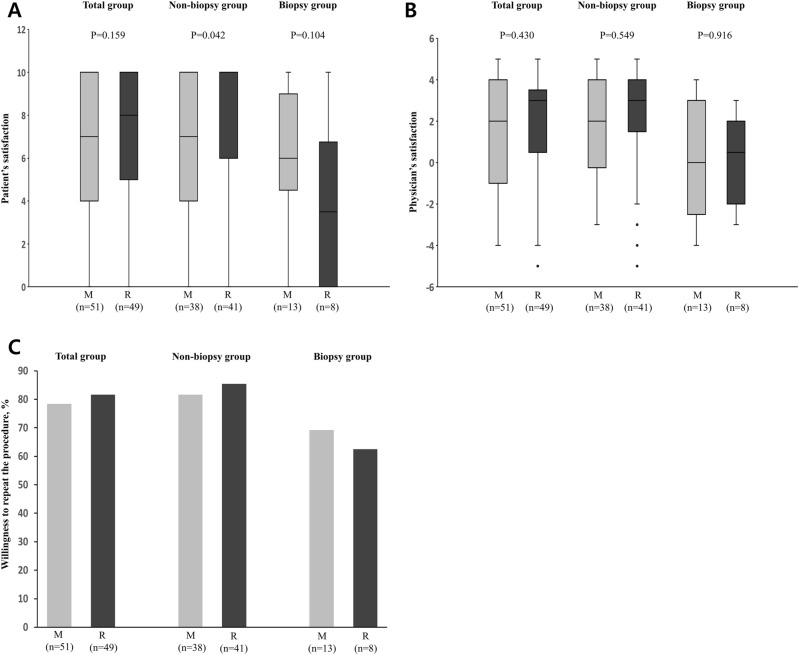
Figure 1.
Satisfaction profiles. Box plot of patient and physician satisfaction with sedation ((A) and (B)). In the box plots, a horizontal black line denotes the median value. Upper and lower boundary of the box denote 1st and 3rd quartile, respectively. Vertical lines above and below the box indicate the 10th and 90th percentiles, respectively. Dots below the vertical line denote outliers outside the 90th percentile. In patients with non-biopsy procedures (n = 79), patient satisfaction was significantly higher in the remimazolam group than in the midazolam group (median [IQR], 10 [6–10] vs. 7 [4–10], P = 0.042]. Percentage of patients who showed willingness to repeat the procedure in each group (C). IQR interquartile range, M midazolam, R remimazolam.

