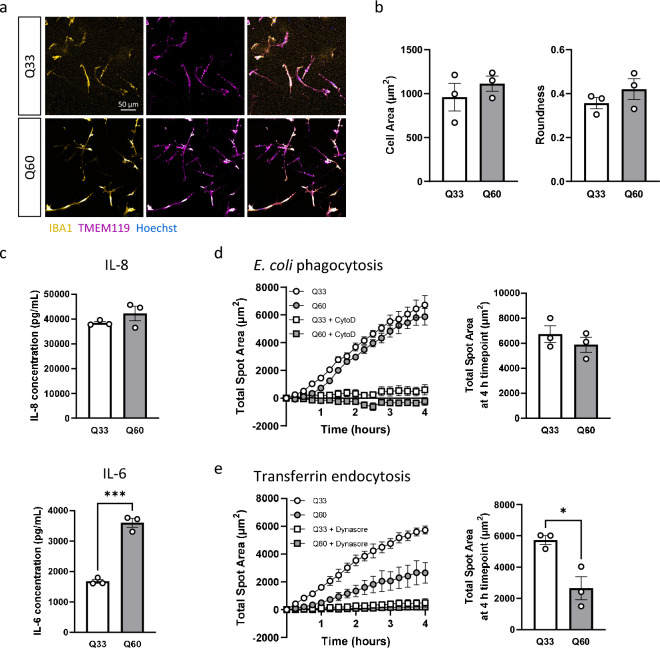
Figure 5.
Q60 iPSC-microglia showed impairment in endocytosis and increased cytokine secretion compared to Q33 iPSC-microglia. (a) Confirmation of cell identity of both Q33 and Q60 iPSC-microglia using IBA1 and TMEM119. Scale bar = 50 μm. (b) Investigation of iPSC-microglia morphology showed no differences between Q33 and Q60 iPSC-microglia in cell area and roundness. (c) Unstimulated iPSC-microglia supernatants were assessed by ELISA for the secretion of the cytokines IL-8 and IL-6. Unstimulated Q60 iPSC-microglia showed an increased secretion of IL-6, but not IL-8. (d) Phagocytosis was assessed via the uptake of pHrodo-conjugated E. coli particles. Q33 and Q60 iPSC-microglia were imaged every 15 min for 4 h. Uptake of E. coli particles was inhibited by the addition of 30 μM cytochalasin D (CytoD) for 1 h prior and during phagocytosis. Total spot area of phagocytosed E. coli after 4 h was not different between Q33 and Q60 iPSC-microglia. (e) Endocytosis was assessed via the uptake of pHrodo-conjugated transferrin particles. Q33 and Q60 iPSC-microglia were imaged every 10 min for 4 h. Uptake of transferrin particles was inhibited by the addition of 30 μM dynasore for 1 h prior and during endocytosis. Total spot area of transferrin particles was significantly reduced in Q60 iPSC-microglia compared to Q33 control iPSC-microglia. Data are expressed as mean ± SEM. n = 3 independent experimental repeats with 1 clone. Statistical analysis was performed using unpaired t-test. *p < 0.05; ***p < 0.001.

