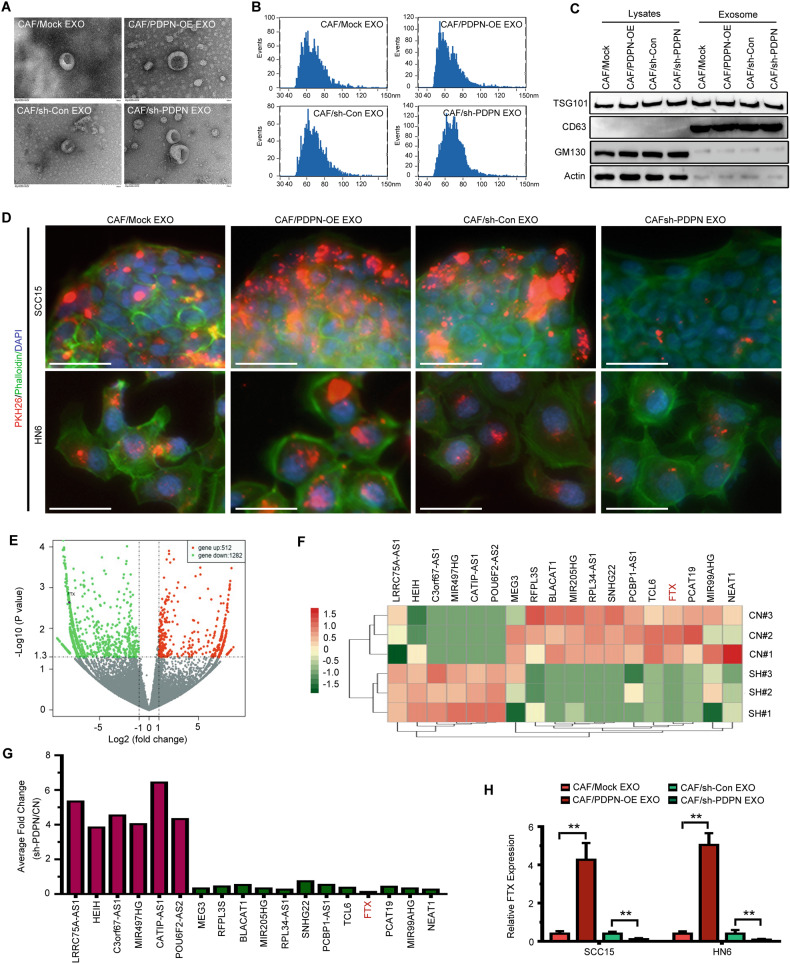
Fig. 3. OSCC cells absorb exosomes derived from PDPN-transfected CAFs.
A Transmission electron microscopy (TEM) showing exosomes isolated from PDPN-transfected CAFs conditioned medium. Scale bar, 100 nm. B The size distribution exosomes from PDPN-transfected CAFs examined by nanoparticle tracking analysis (NTA). C Western blot analysis of exosomes from PDPN-transfected CAFs. D OSCC cells absorbed PKH26-labeled exosomes (red) secreted by PDPN-transfected CAFs. Fluorescence microscopy was used to detect the phalloidin (green) and PKH26-labeled exosomes (red) fluorescent signals in OSCC cells. Bar, 100 μm. E, F Volcano plot (E) and heatmap diagram (F) showing differentially expressed lncRNAs between CAF/Control and CAF/sh-PDPN derived exosomes. G The expression of the selected lncRNAs in the CAF/Control and CAF/sh-PDPN derived exosomes was validated by qRT-PCR. H The expression of FTX in OSCC cells treated with PDPN-transfected CAFs derived exosomes was validated by qRT-PCR. Student’s t test for two-group comparison: **P < 0.01.

