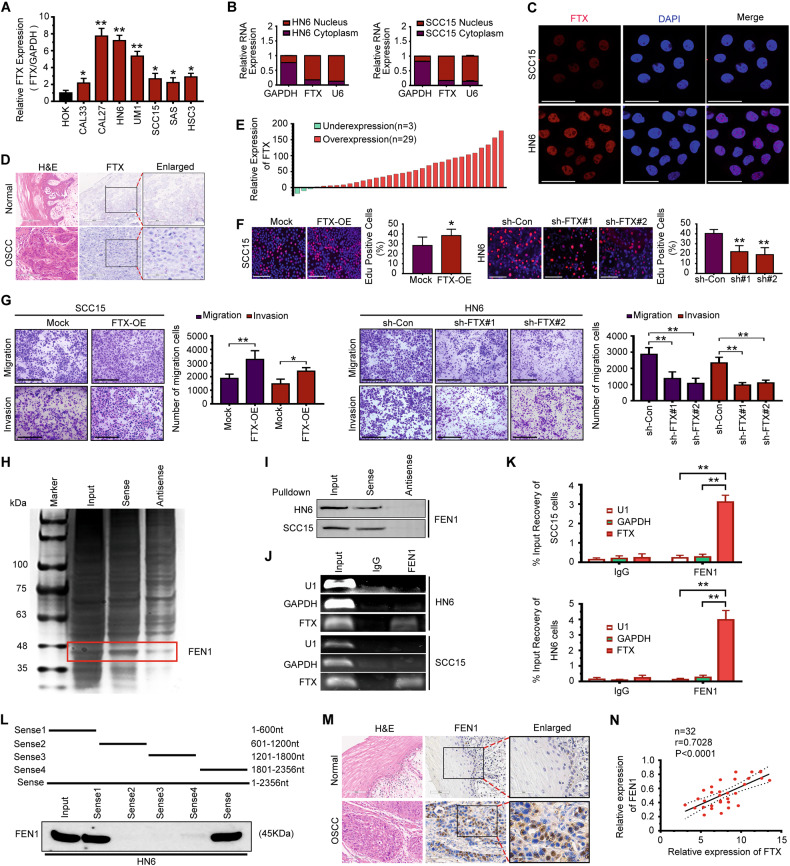
Fig. 4. LncRNA FTX promotes OSCC cell motility and proliferation by interacting with FEN1.
A qRT-PCR analysis was used to detect the expression of FTX in OSCC cell lines. Student’s t test for two-group comparison: *P < 0.05; **P < 0.01. B The expression of FTX in the subcellular fractions of WSU-HN6 and SCC15 cells were detected by qRT-PCR. U6 and GAPDH were used as nuclear and cytoplasmic markers, respectively. C The location of FTX (red) in WSU-HN6 and SCC15 cells were determined by FISH assay. D Representative ISH staining of FTX in OSCC and normal tissue sections. Small and large black frames indicate the original and magnified areas, respectively. Bar, 100 µm. E The expression level of FTX in OSCC patient tissue and adjacent normal tissue were detected by qRT-PCR (n = 32). F The effect of FTX transfection in the growth rate of both WSU-HN6 and SCC15 cells examined using EdU assays. Scale bar, 200 μm. Student’s t test for two-group comparison: *P < 0.05; **P < 0.01. G The effect of FTX transfection on the migration and invasion of SCC15 and WSU-HN6 cells was examined using the transwell assay. Scale bar, 200 μm. Student’s t test for two-group comparison: *P < 0.05; **P < 0.01. H Silver staining of biotinylated FTX-associated proteins. I The specific association of FTX with the FEN1 protein was validated through RNA pulldown, followed by western blotting. J, K PCR was used to measure the RNA enrichment in the RIP assay using the anti-FEN1 antibody in SCC15 and WSU-HN6 cells. Normal IgG was used as the nonspecific control antibody. U1 and GAPDH were used as negative controls. Student’s t test for two-group comparison: **P < 0.01. L Serial deletions of FTX were used in the RNA pulldown assays. M Representative H&E and immunohistochemical staining for FEN1 in paraffin-embedded OSCC and adjacent normal tissue sections. Small and large black frames indicate the original and magnified areas, respectively. Bar, 100 µm. N The correlation between FTX and FEN1 mRNA expression in fresh OSCC tissue samples (n = 32).

