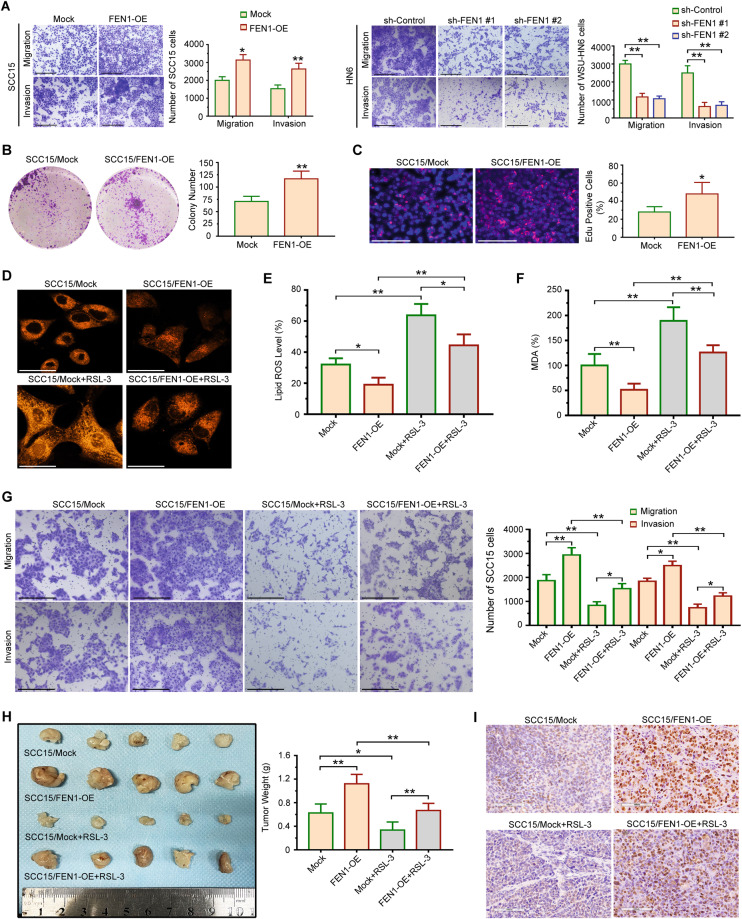
Fig. 6. FEN1 overexpression promotes OSCC cells motility and proliferation by regulating ferroptosis in vitro and in vivo.
A The effect of FEN1 transfection on the migration and invasion of SCC15 and WSU-HN6 cells was examined using the transwell assay. Scale bar, 200 μm. Student’s t test for two-group comparison: *P < 0.05; **P < 0.01. B, C The effect of FEN1 overexpression on OSCC cells growth examined using colony formation assay (B) and EdU assays (C). Scale bar, 200 μm. Student’s t test for two-group comparison: *P < 0.05; **P < 0.01. D The effect of adding RSL-3 on the level of intracellular iron in FEN1 overexpressed OSCC cells was determined using FerroOrange. Scale bar, 50 μm. E The effect of adding RSL-3 on the level of lipid ROS in FEN1 overexpressed OSCC cells was measured by ROS assay kit. One-way ANOVA for multi-group comparisons: *P < 0.05; **P < 0.01. F The effect of adding RSL-3 on level of Malondialdehyde (MDA) in FEN1 overexpressed OSCC cells was evaluated by a lipid peroxidation MDA assay. One-way ANOVA for multi-group comparisons: **P < 0.01. G Transwell assay was used to determine the effect of RSL-3 treatment on migration and invasion of FEN1 overexpressed SCC15 cells. Scale bar, 200 μm. One-way ANOVA for multi-group comparisons: *P < 0.05; **P < 0.01. H SCC15/Mock, SCC15/FEN1-OE, SCC15/Mock+RSL-3, and SCC15/FEN1-OE + RSL-3 cells were injected into nude mice (n = 5 for each group) subcutaneously. Tumors weigh was evaluated. One-way ANOVA for multi-group comparisons: *P < 0.05; **P < 0.01. I Representative immunohistochemical staining images of Ki 67 in xenografts were shown. Scale bar, 100 μm.

