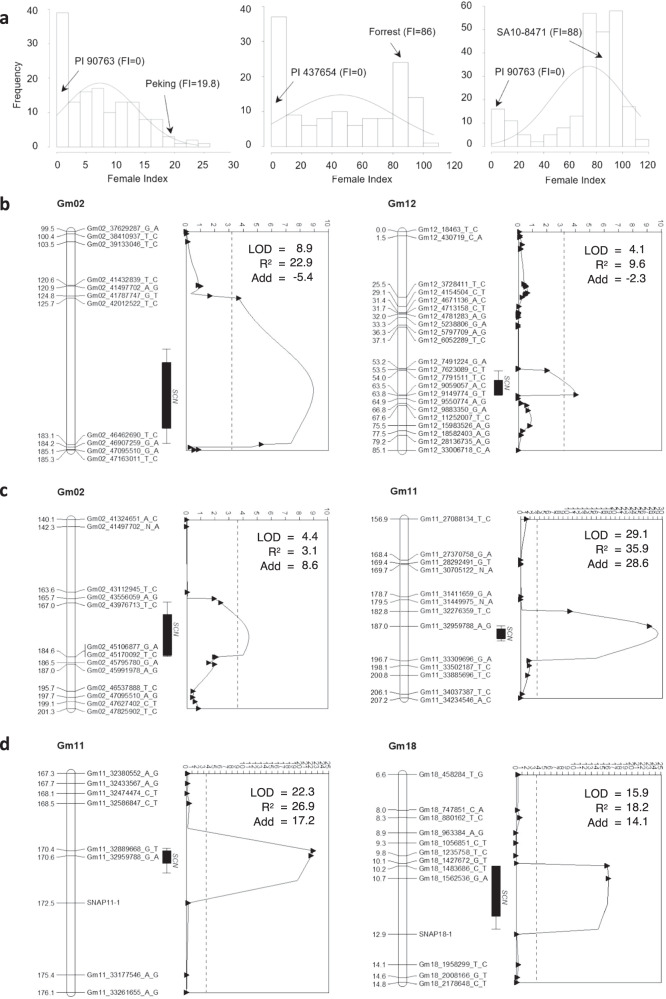
Fig. 1. Mapping of quantitative trait loci (QTL) controlling soybean cyst nematode (SCN) HG type 1.2.5.7 resistance.
a Frequency distribution of female indices (FI) in 144 F3:4 lines from PI 90763 × Peking, 131 F3:4 lines from Forrest × PI 437654, and 244 F3:4 lines of SA10-8471 × PI 90763. b QTL02 and QTL12 detected in PI 90763 × Peking population. c QTL02 and QTL11 detected in Forrest × PI 437654 population. d QTL11 and QTL18 detected in SA10-8471 × PI 90763 population. Scales on the top of the graph represent the value of the logarithm of the odds (LOD). The black dotted line indicates the threshold of significance (LOD = 3.2, 3.6, and 3.5) for each population, respectively. Add = additive effect.

