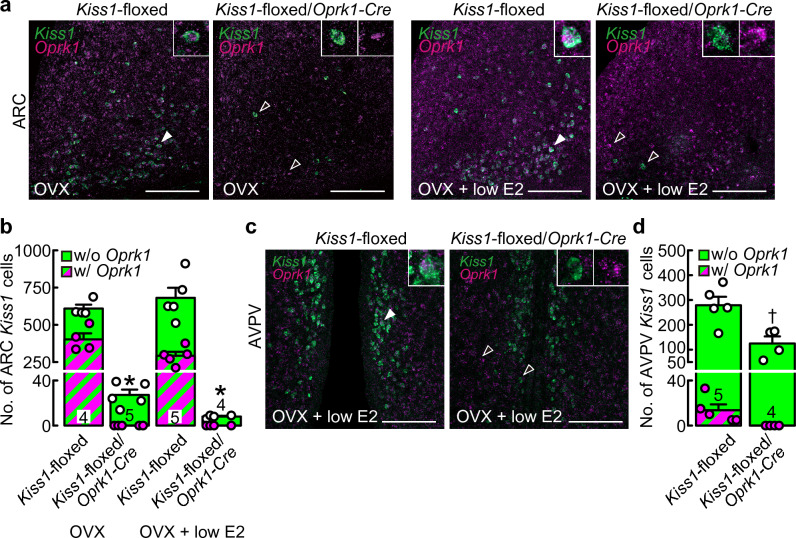
Figure 3.
Kiss1 deletion in cells expressing or having expressed Oprk1 reduced the number of ARC and AVPV Kiss1-expressing cells. (a) Kiss1-expressing (green) and Oprk1-expressing (magenta) cells in the ARC of representative ovariectomized (OVX) or OVX and treated with a negative feedback level of estradiol-17β (OVX + low E2) Kiss1-floxed/Oprk1-Cre rats and their counterpart Cre(−)/Kiss1-floxed rats. (b) The numbers of Kiss1-expressing (green) or Kiss1- and Oprk1-coexpressing (striped) cells in the ARC of OVX or OVX + low E2 Kiss1-floxed/Oprk1-Cre rats and Cre(−)/Kiss1-floxed control rats. Asterisks indicate a statistically significant main effect of the genotype (p < 0.05) based on two-way ANOVA. (c) Kiss1-expressing (green) and Oprk1-expressing (magenta) cells in the AVPV of representative OVX + low E2 Kiss1-floxed/Oprk1-Cre rats and their counterpart Cre(−)/Kiss1-floxed rats. The insets indicate representative Kiss1- and Oprk1-coexpressing cells, indicated by the solid white arrowheads, or Kiss1- or Oprk1-expressing cells, indicated by the open white arrowheads. Scale bars, 100 μm. (d) The numbers of Kiss1-expressing (green) or Kiss1- and Oprk1-coexpressing (striped) cells in the AVPV of OVX + low E2 Kiss1-floxed/Oprk1-Cre rats and Cre(−)/Kiss1-floxed control rats. A dagger indicates a statistically significant difference (p < 0.05) between the groups based on Student’s t-test. Values are the means ± SEM. Circles indicate the individual data of the number of Kiss1-expressing (white) or Kiss1- and Oprk1-coexpressing (magenta) cells. Numbers in (or on) each column indicate the number of animals used.

