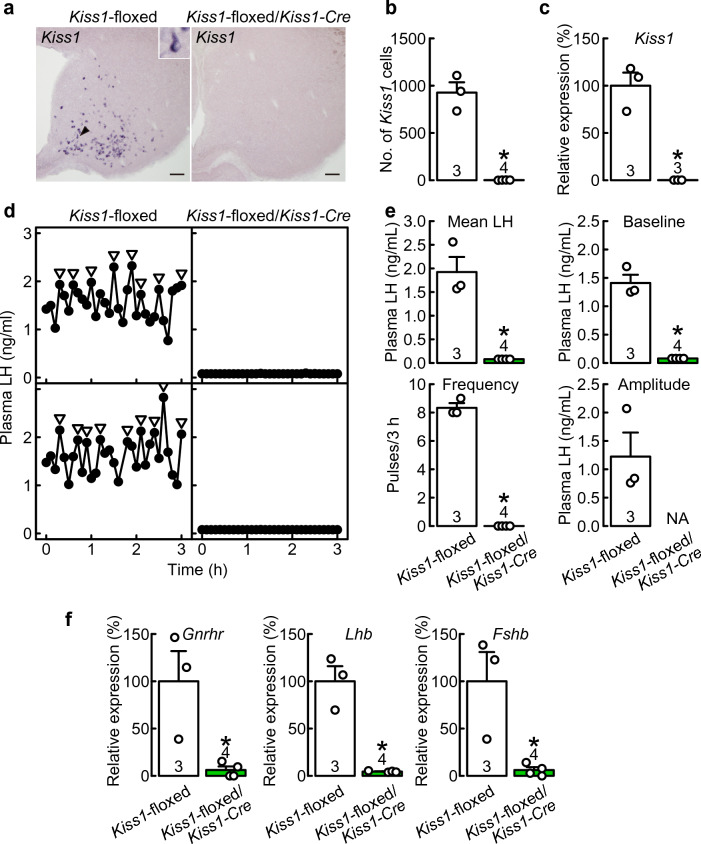
Figure 6.
Kiss1-floxed/Kiss1-Cre rats exhibited few ARC Kiss1-expressing cells and complete suppression of LH pulses. (a) Kiss1-expressing cells in the ARC of representative OVX Kiss1-floxed/Kiss1-Cre rats and Cre(−)/Kiss1-floxed control rats. (b) The numbers of Kiss1-expressing cells in the ARC of OVX Kiss1-floxed/Kiss1-Cre rats and Cre(−)/Kiss1-floxed control rats. (c) ARC Kiss1 mRNA expression in OVX Kiss1-floxed/Kiss1-Cre rats and Cre(−)/Kiss1-floxed control rats. The ARC Kiss1 mRNA expression was determined by RT-qPCR. (d) Plasma LH profiles of two representative OVX Kiss1-floxed/Kiss1-Cre rats and Cre(−)/Kiss1-floxed control rats. Arrowheads indicate LH pulses identified with the PULSAR computer program. (e) Mean LH concentrations and the baseline, frequency, and amplitude of LH pulses in OVX Kiss1-floxed/Kiss1-Cre rats and Cre(−)/Kiss1-floxed rats. (f) Pituitary Gnrhr, Lhb, and Fshb mRNA expression in OVX Kiss1-floxed/Kiss1-Cre rats and Cre(−)/Kiss1-floxed rats were determined by RT-qPCR. Values are the means ± SEM. Open circles indicate the individual data. Numbers in (or on) each column indicate the number of animals used. Asterisks indicate statistically significant differences (p < 0.05) between the groups based on Student’s t-test. NA, not applicable, as no LH pulses were detected in OVX Kiss1-floxed/Kiss1-Cre rats.

