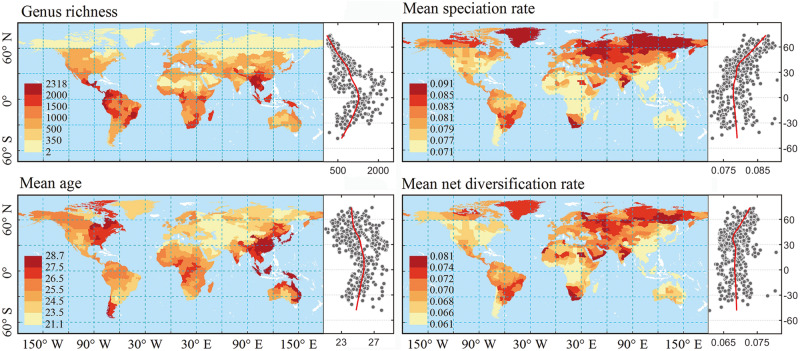
Fig. 3. Global patterns and latitudinal gradients of angiosperm generic diversity, mean genus age, mean speciation rates and mean net diversification rates.
Generic diversity is a quadratic function of latitude (r2 = 0.42): diversity is the highest in tropical regions and decreases towards the poles. Mean genus age and mean evolutionary rates are estimated using the global phylogeny with angiosperms crown age constrained to 140–150 Ma. Regions with no distributional data are shown in white. Solid red lines on the scatter plots represent lowess regression with span of 0.5. The same results based on only monophyletic genera are shown in Fig. S9.

