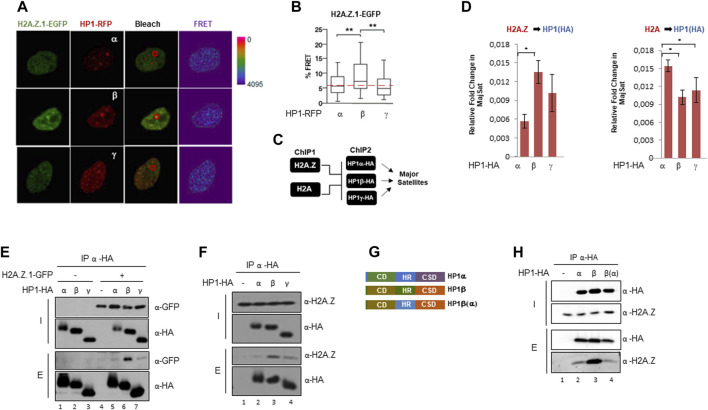
FIGURE 3.
H2A.Z.1 preferentially interacts with HP1β in PCH regions. (A) Representative images of the FRET experiments between H2A.Z.1-EGFP and HP1-RFP in PCH foci of NIH3T3 cells. The bleaching area is marked with a red circle. (B) Relative quantification of FRET analysis showed in (A). **p < 0.01. Relative FRET % was calculated considering 100% as the FRET value that was obtained for GFP-RPF (positive control) and 0% as the value obtained for the FRET value that was obtained for the donor construct alone. (C) Schematic representation of reChIPs experimental workflow. First ChIP was performed against H2A.Z or H2A followed by a second ChIP against HP1α-HA, HP1β-HA or HP1γ-HA. (D) ReChIPs experiments of endogenous H2A.Z or H2A (ChIP #1) and HP1-HA isoforms (ChIP #2) in major satellites of NIH3T3 cells previously transfected with HA-tagged HP1 isoforms. Relative fold enrichment for HP1(HA) isoforms in H2A.Z (left) or H2A (right) ChIP elutions in Major Satellites are indicated. A quantification of n = 3 independent experiments is shown. *p < 0.05. (E) HA Immunoprecipitation experiments in nuclear extracts of HEK293F expressing H2A.Z.1-GFP and the three HA-tagged HP1 isoforms. Inputs (I) and elutions (E) are shown, (F) HA Immunoprecipitation as in (E) to test interaction between endogenous H2A.Z and HP1-HA isoforms in co-IP experiments. (G) Schematic domains representation of HP1α, HP1β and HP1β(α) generated by exchanging the hinge region (HR) from HP1β (aa79-113) to HP1α (aa78-117) (Raurell-Vila et al., 2017). (H) Interaction between endogenous H2A.Z and HP1α, HP1β and HP1β(α)-HA in co-IP experiments using HA beads in whole cell extracts of HEK293F cells.

