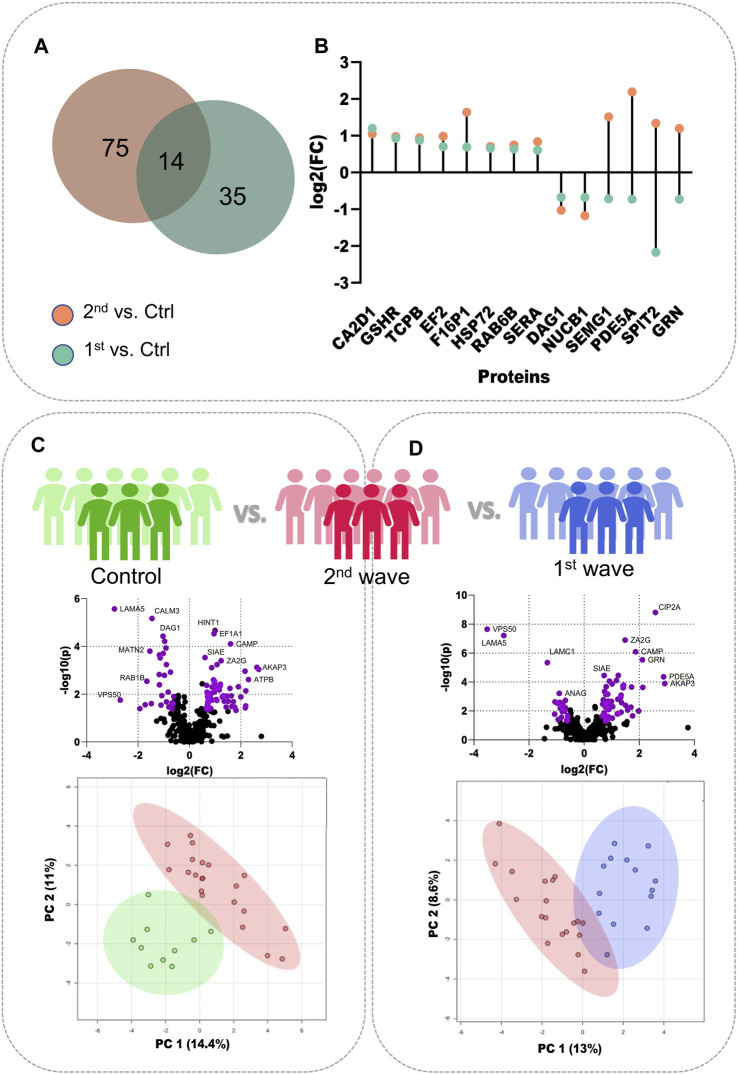
FIGURE 2.
Individual comparisons between the different sample sets. (A) Venn diagram showing DEPs common and unique to the samples from two waves. (B) Dot plot showing the trends of 14 common DEPs identified from the two COVID-19 waves. (C) Volcano plot showing DEPs identified on comparing the control samples with 2nd wave and the clustering on PCA, (D) Volcano plot showing DEPs identified on comparing the samples from two waves and their clustering on PCA.

