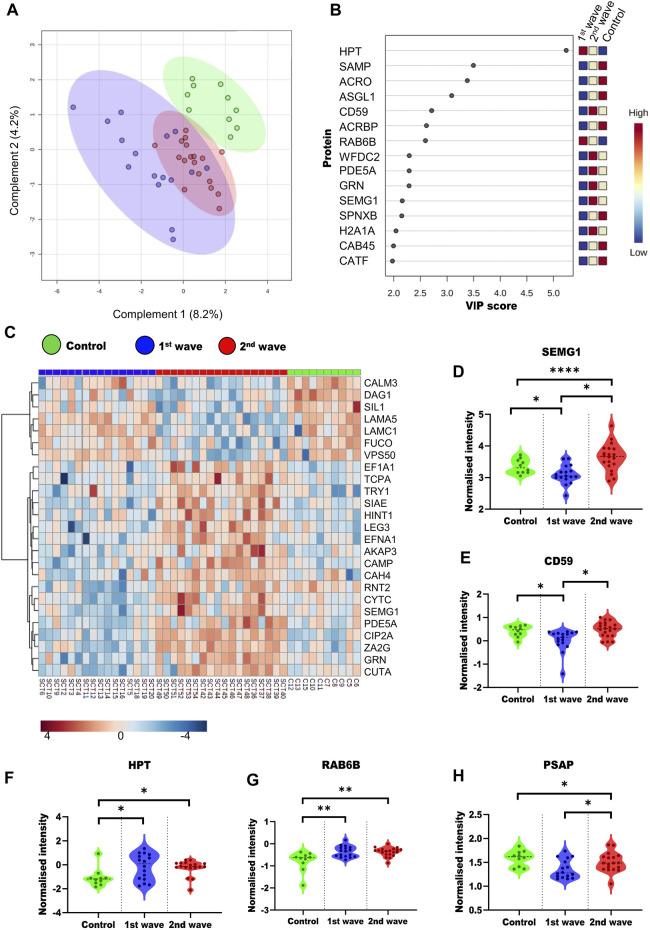
FIGURE 3.
Overall dysregulation in the male reproductive system post recovery from COVID-19 across the different waves (A) PLS-DA plot showing the three groups included in study (B) Top 15 important proteins based on the VIP scores based on PLS-DA. (C) Heatmap visualizing the trends across the three groups for the top 25 proteins based on ANOVA. Violin plots of SEMG1 (D), CD59 (E), HPT (F), RAB6B (G), and PSAP (H) proteins show their trend in different groups.

