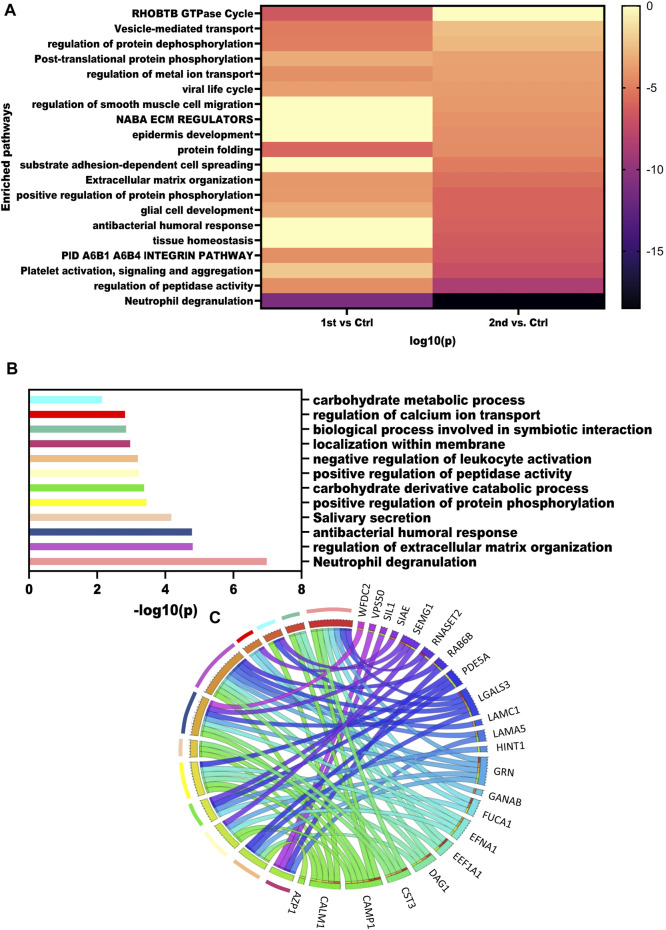
FIGURE 4.
Dysregulated pathways in recovered males. (A) Enrichment heatmap showing pathways mapped in different comparisons using all the DEPs identified. (B) Bar plot showing the dysregulated pathways based on the top 15 VIP score proteins. (C) Circus plot showing the map of VIP proteins and the pathways that were enriched.

