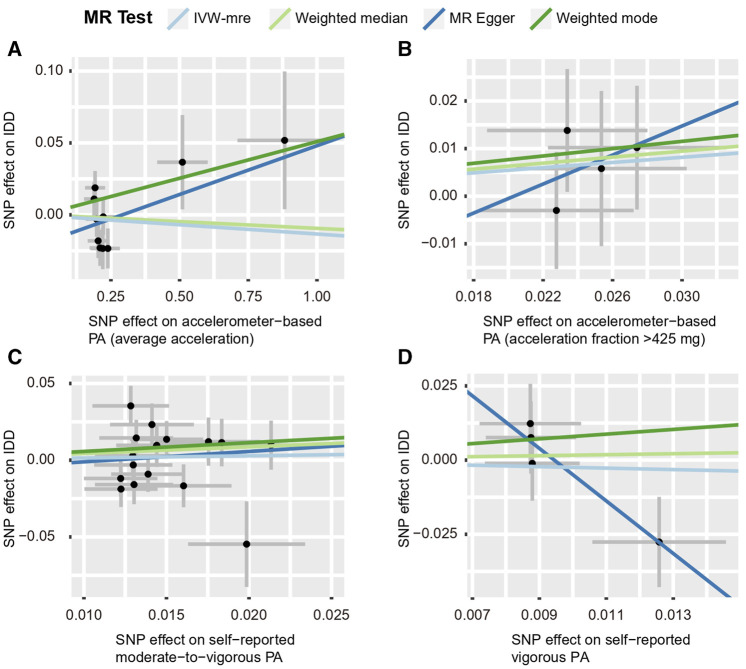
FIGURE 6.
Scatter plots for MR analyses of the causal effect of PA on IDD. (A) accelerometer-based PA (average acceleration); (B) accelerometer-based PA (acceleration fraction >425 mg); (C) self-reported moderate-to-vigorous PA; (D) self-reported vigorous PA. Analyses were conducted using the conventional IVW, WMM, MR-Egger, and weighted mode methods. The slope of each line corresponds to the estimated MR effect per method. IVW-mre, multiplicative random effects inverse variance weighting.

