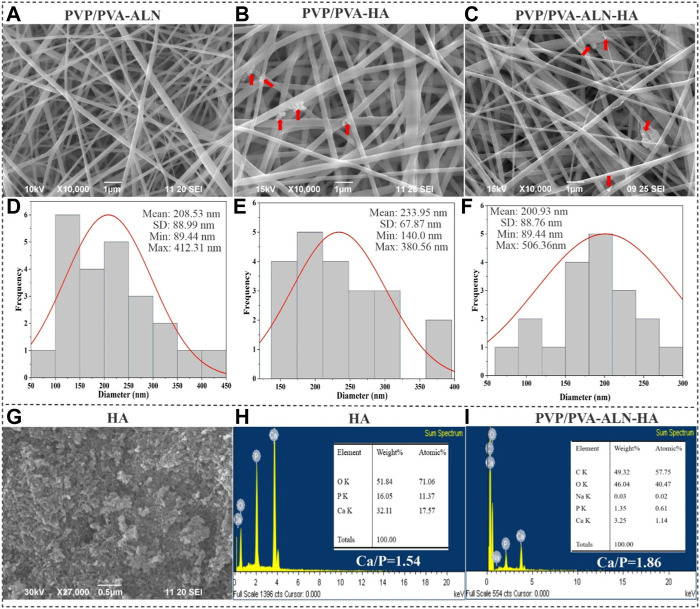
FIGURE 2.
SEM images of (A) PVP/PVA-ALN, (B) PVP/PVA-HA and (C) PVP/PVA-ALN-HA nanofibers, and the red arrow in the SEM images indicates the presence of HA into nanofiber scaffolds; (D–F) Represents their corresponding histogram showing average diameters; (G) SEM image of HA nanoparticles; (H) EDX analysis of HA nanoparticles; (I) EDX analysis of PVP/PVA-ALN-HA nanofiber composite scaffold.

