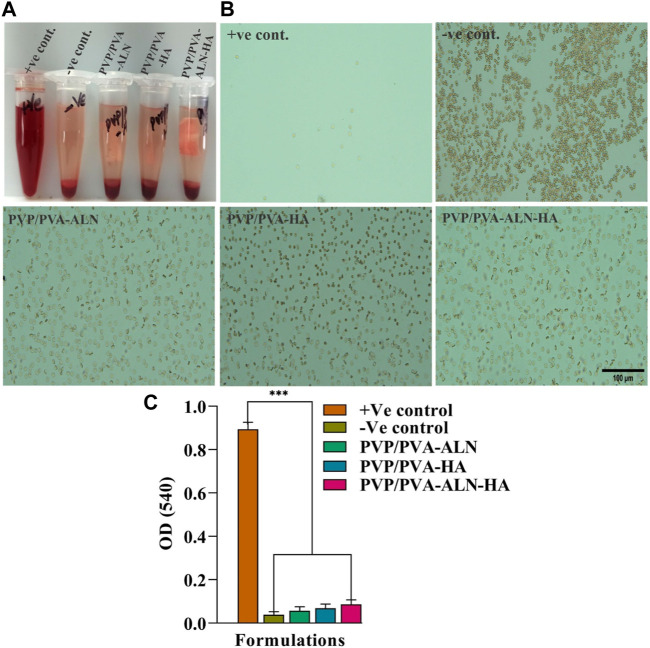
FIGURE 5.
The study of hemolysis and the effect of scaffold on the lysis RBCs; (A) The hemolytic behavior of all the groups; (B) The microscopic image of intact RBCs status after 3 h of incubation with the control groups and nanofiber group PVP/PVA-ALN, PVP/PVA-HA and PVP/PVA-ALN-HA; (C) The histogram demonstrated the absorbance value of +Ve control, -Ve control, PVP/PVA-ALN, PVP/PVA-HA and PVP/PVA-ALN-HA at 540 nm. All the significant values are denoted as *p ≤ 0.05, **p ≤ 0.01, ***p ≤ 0.001.

