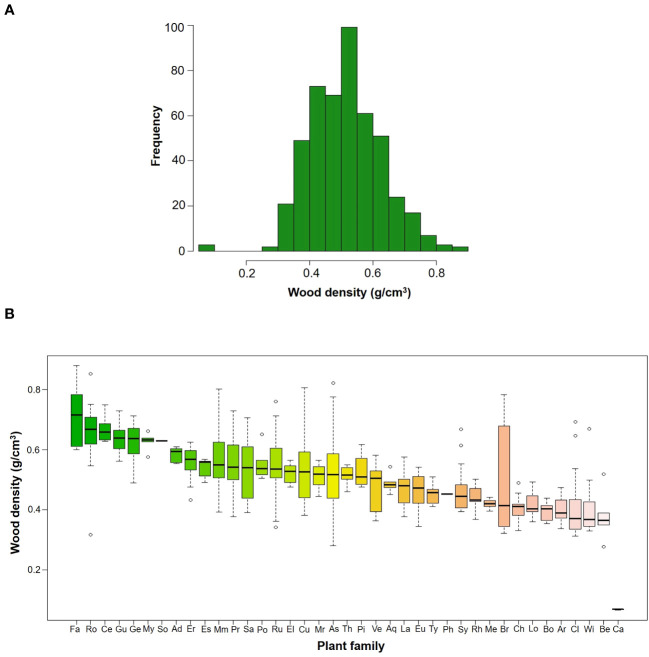
Figure 2.
(A) Frequency histograms of WD by species in upper Andean tropical forests (B) Box plots of WD by families; the horizontal line is the median, the box is 50% of data, while the whisker extends to the furthest data point in each wing that is within 1.5 times the Interquartile range. Family acronyms are found in Table 2 .

